Student Population by Gender
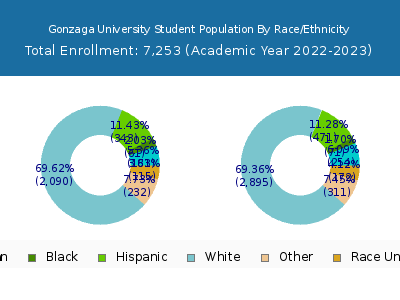
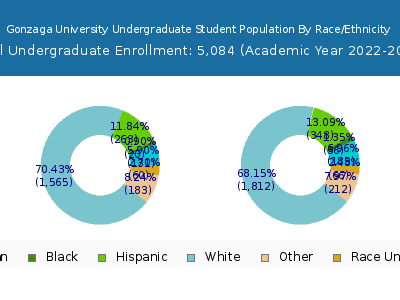
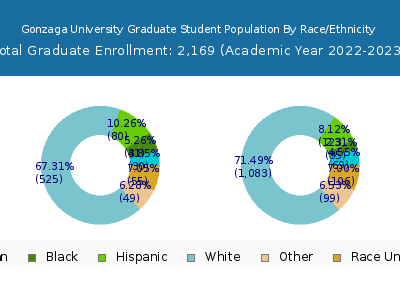
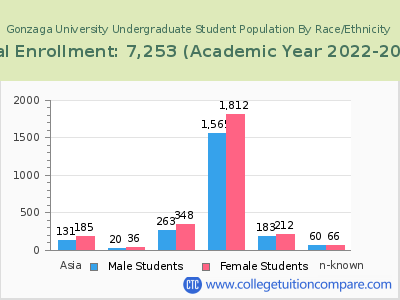
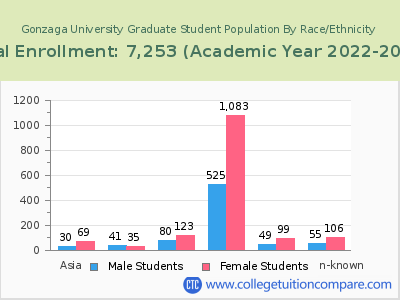
Gonzaga University has a total of 7,253 enrolled students for the academic year 2022-2023. 5,084 students have enrolled in undergraduate programs and 2,169 students joined graduate programs.
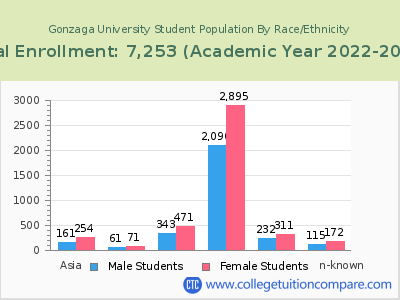
By gender, 3,103 male and 4,150 female students (the male-female ratio is 43:57) are attending the school. The gender distribution is based on the 2022-2023 data.
| Total | Undergraduate | Graduate | |
|---|---|---|---|
| Total | 7,253 | 5,084 | 2,169 |
| Men | 3,103 | 2,346 | 757 |
| Women | 4,150 | 2,738 | 1,412 |
Student Distribution by Race/Ethnicity
| Race | Total | Men | Women |
|---|---|---|---|
| American Indian or Native American | 54 | 21 | 33 |
| Asian | 420 | 161 | 259 |
| Black | 122 | 57 | 65 |
| Hispanic | 859 | 352 | 507 |
| Native Hawaiian or Other Pacific Islanders | 25 | 12 | 13 |
| White | 4,598 | 1,962 | 2,636 |
| Two or more races | 460 | 207 | 253 |
| Race Unknown | 398 | 165 | 233 |
| Race | Total | Men | Women |
|---|---|---|---|
| American Indian or Native American | 25 | 9 | 16 |
| Asian | 335 | 138 | 197 |
| Black | 58 | 21 | 37 |
| Hispanic | 648 | 273 | 375 |
| Native Hawaiian or Other Pacific Islanders | 18 | 8 | 10 |
| White | 3,276 | 1,524 | 1,752 |
| Two or more races | 380 | 180 | 200 |
| Race Unknown | 155 | 74 | 81 |
| Race | Total | Men | Women |
|---|---|---|---|
| American Indian or Native American | 1 | 0 | 1 |
| Asian | 4 | 1 | 3 |
| Black | 4 | 1 | 3 |
| Hispanic | 16 | 9 | 7 |
| Native Hawaiian or Other Pacific Islanders | 1 | 1 | 0 |
| White | 88 | 51 | 37 |
| Two or more races | 7 | 4 | 3 |
| Race Unknown | 0 | 0 | 0 |
Student Age Distribution
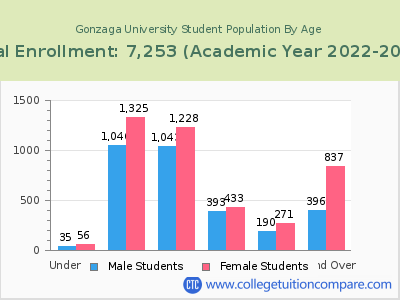
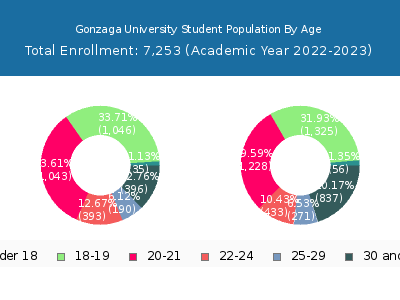
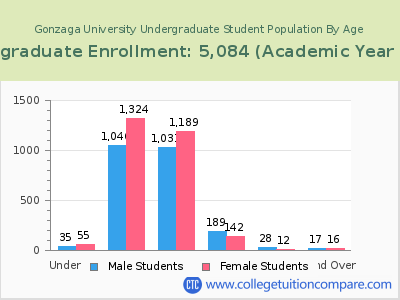
By age, Gonzaga has 91 students under 18 years old and 8 students over 65 years old. There are 5,559 students under 25 years old, and 1,694 students over 25 years old out of 7,253 total students.
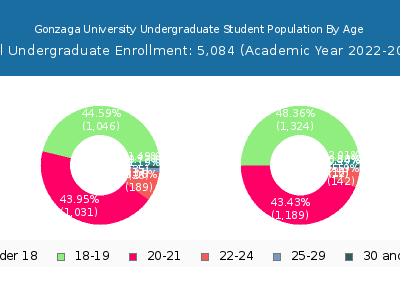
In undergraduate programs, 90 students are younger than 18 and 1 students are older than 65. Gonzaga has 5,011 undergraduate students aged under 25 and 73 students aged 25 and over.
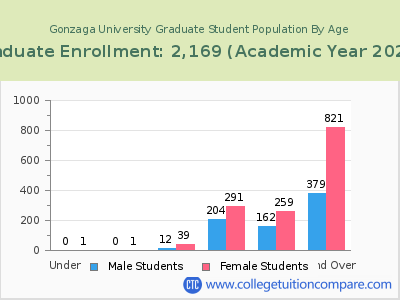
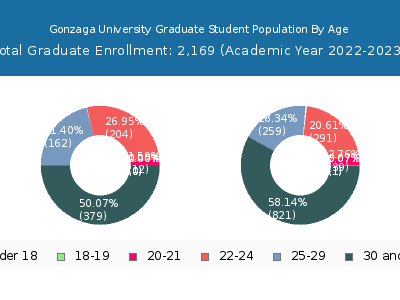
In graduate schools at Gonzaga, 1 students are younger than 18 and 7 students are older than 65. It has 548 graduate students aged under 25 and 1,621 students aged 25 and over.
| Age | Total | Men | Women |
|---|---|---|---|
| Under 18 | 91 | 56 | 35 |
| 18-19 | 2,371 | 1,325 | 1,046 |
| 20-21 | 2,271 | 1,228 | 1,043 |
| 22-24 | 826 | 433 | 393 |
| 25-29 | 461 | 271 | 190 |
| 30-34 | 323 | 221 | 102 |
| 35-39 | 293 | 179 | 114 |
| 40-49 | 424 | 304 | 120 |
| 50-64 | 185 | 126 | 59 |
| Over 65 | 8 | 7 | 1 |
| Age | Total | Men | Women |
|---|---|---|---|
| Under 18 | 90 | 55 | 35 |
| 18-19 | 2,370 | 1,324 | 1,046 |
| 20-21 | 2,220 | 1,189 | 1,031 |
| 22-24 | 331 | 142 | 189 |
| 25-29 | 40 | 12 | 28 |
| 30-34 | 14 | 5 | 9 |
| 35-39 | 6 | 3 | 3 |
| 40-49 | 9 | 5 | 4 |
| 50-64 | 3 | 2 | 1 |
| Over 65 | 1 | 1 | 0 |
| Age | Total | Men | Women |
|---|---|---|---|
| Under 18 | 1 | 1 | 0 |
| 18-19 | 1 | 1 | 0 |
| 20-21 | 51 | 39 | 12 |
| 22-24 | 495 | 291 | 204 |
| 25-29 | 421 | 259 | 162 |
| 30-34 | 309 | 216 | 93 |
| 35-39 | 287 | 176 | 111 |
| 40-49 | 415 | 299 | 116 |
| 50-64 | 182 | 124 | 58 |
| Over 65 | 7 | 6 | 1 |
Online Student Enrollment
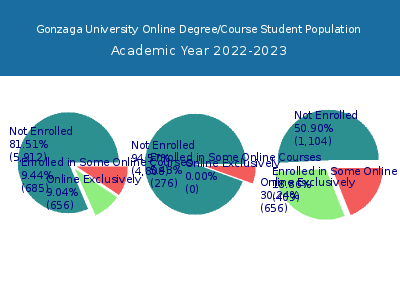
Distance learning, also called online education, is very attractive to students, especially who want to continue education and work in field. At Gonzaga University, 656 students are enrolled exclusively in online courses and 685 students are enrolled in some online courses.
282 students lived in Washington or jurisdiction in which the school is located are enrolled exclusively in online courses and 374 students live in other State or outside of the United States.
| All Students | Enrolled Exclusively Online Courses | Enrolled in Some Online Courses | |
|---|---|---|---|
| All Students | 7,253 | 656 | 685 |
| Undergraduate | 5,084 | 0 | 276 |
| Graduate | 2,169 | 656 | 409 |
| Washington Residents | Other States in U.S. | Outside of U.S. | |
|---|---|---|---|
| All Students | 282 | 368 | 6 |
| Undergraduate | 0 | - | 0 |
| Graduate | 282 | 368 | 6 |
Transfer-in Students (Undergraduate)
Among 5,084 enrolled in undergraduate programs, 165 students have transferred-in from other institutions. The percentage of transfer-in students is 3.25%.164 students have transferred in as full-time status and 1 students transferred in as part-time status.
| Number of Students | |
|---|---|
| Regular Full-time | 4,834 |
| Transfer-in Full-time | 164 |
| Regular Part-time | 85 |
| Transfer-in Part-time | 1 |
