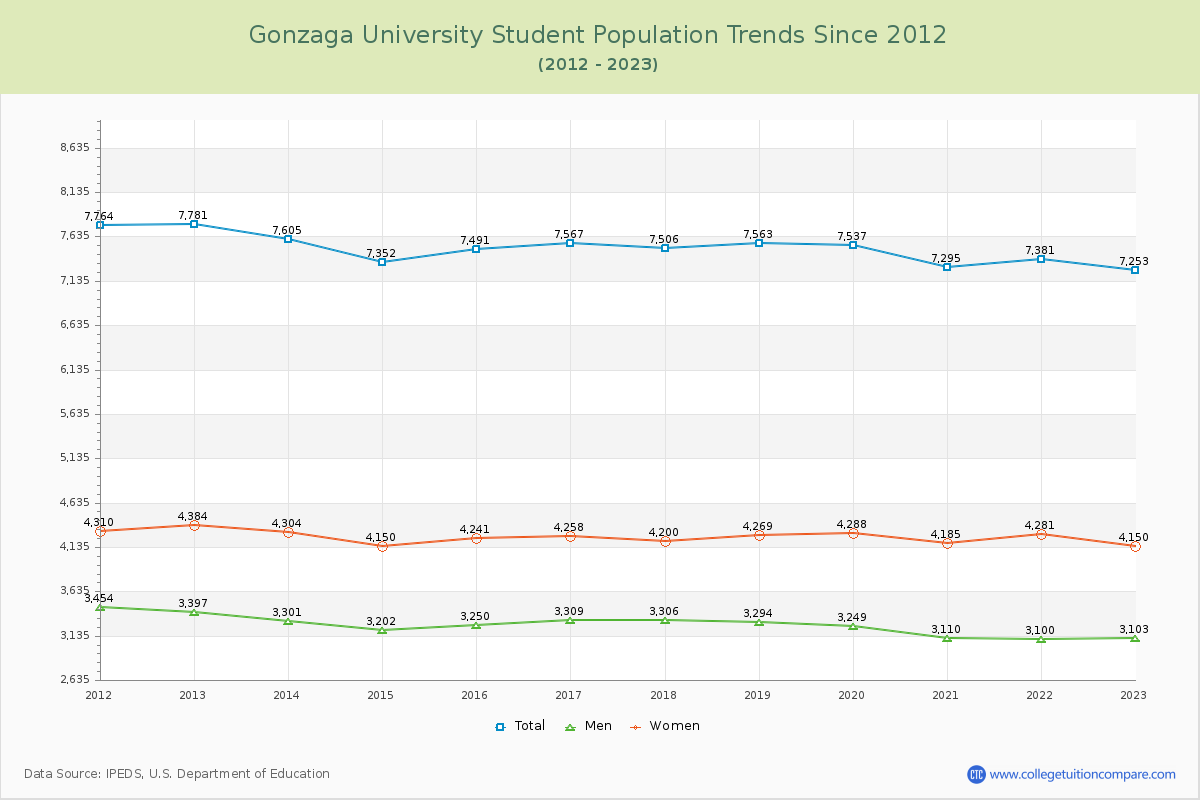
Student Population Changes
The average student population over the last 12 years is 7,485 where 7,253 students are attending the school for the academic year 2022-2023.
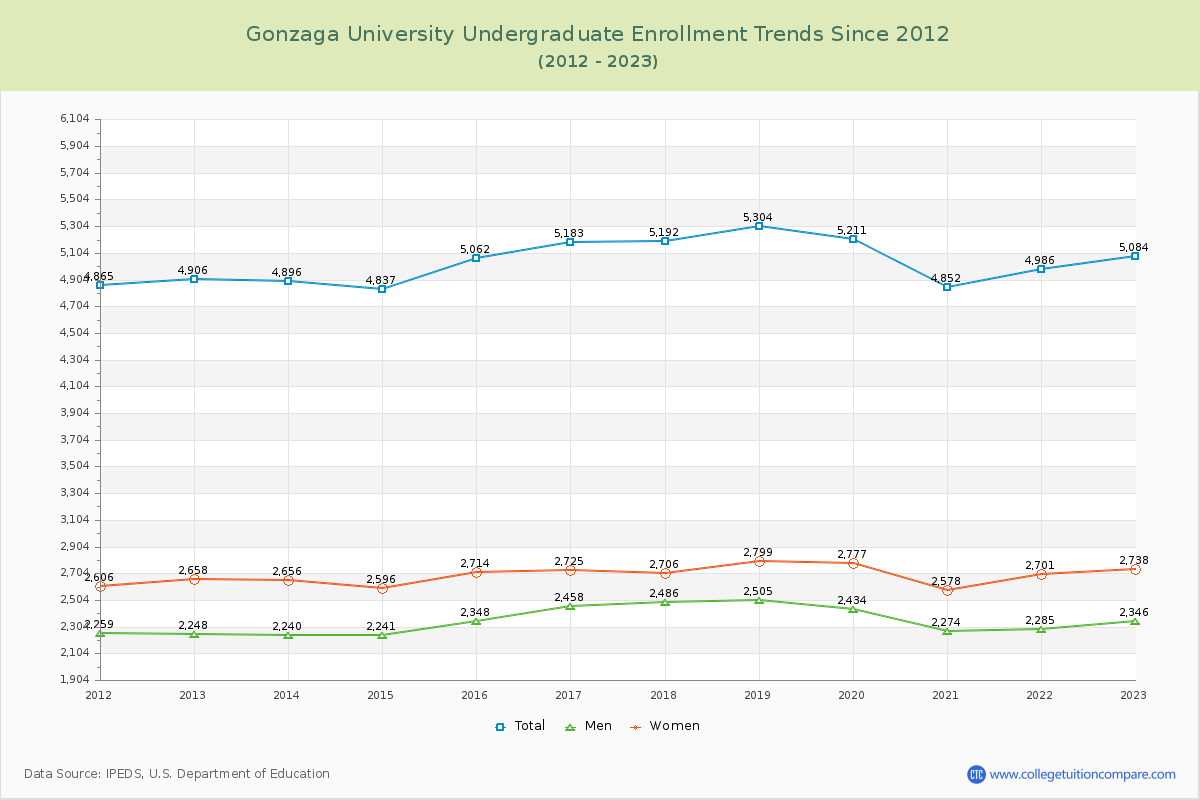
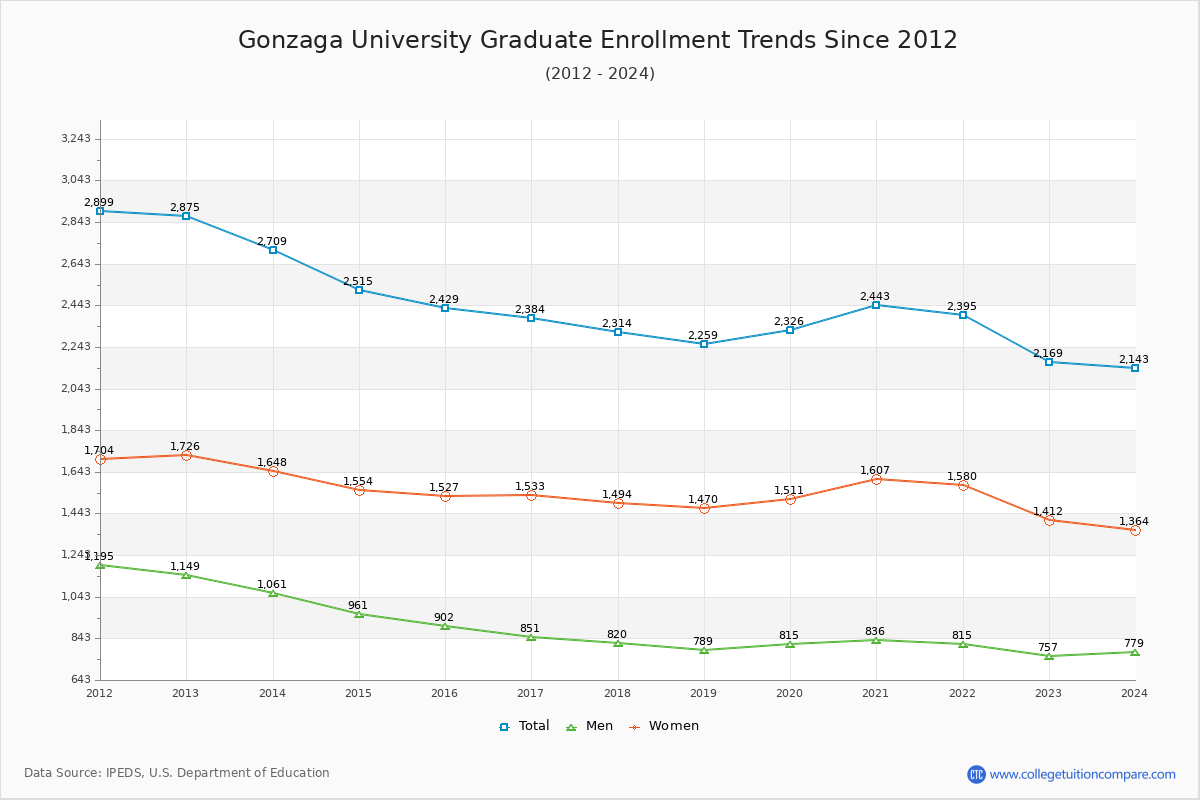
70.10% of total students is undergraduate students and 29.90% students is graduate students. The number of undergraduate students has increased by 178 and the graduate enrollment has decreased by 706 over past 10 years.
The female to male ratio is 1.34 to 1 and it means that there are more female students enrolled in Gonzaga than male students.
The following table and chart illustrate the changes in student population by gender at Gonzaga University since 2012.
| Year | Total | Undergraduate | Graduate | ||||
|---|---|---|---|---|---|---|---|
| Total | Men | Women | Total | Men | Women | ||
| 2012-13 | 7,781 | 4,906 | 2,248 | 2,658 | 2,875 | 1,149 | 1,726 |
| 2013-14 | 7,605 -176 | 4,896 -10 | 2,240 -8 | 2,656 -2 | 2,709 -166 | 1,061 -88 | 1,648 -78 |
| 2014-15 | 7,352 -253 | 4,837 -59 | 2,241 1 | 2,596 -60 | 2,515 -194 | 961 -100 | 1,554 -94 |
| 2015-16 | 7,491 139 | 5,062 225 | 2,348 107 | 2,714 118 | 2,429 -86 | 902 -59 | 1,527 -27 |
| 2016-17 | 7,567 76 | 5,183 121 | 2,458 110 | 2,725 11 | 2,384 -45 | 851 -51 | 1,533 6 |
| 2017-18 | 7,506 -61 | 5,192 9 | 2,486 28 | 2,706 -19 | 2,314 -70 | 820 -31 | 1,494 -39 |
| 2018-19 | 7,563 57 | 5,304 112 | 2,505 19 | 2,799 93 | 2,259 -55 | 789 -31 | 1,470 -24 |
| 2019-20 | 7,537 -26 | 5,211 -93 | 2,434 -71 | 2,777 -22 | 2,326 67 | 815 26 | 1,511 41 |
| 2020-21 | 7,295 -242 | 4,852 -359 | 2,274 -160 | 2,578 -199 | 2,443 117 | 836 21 | 1,607 96 |
| 2021-22 | 7,381 86 | 4,986 134 | 2,285 11 | 2,701 123 | 2,395 -48 | 815 -21 | 1,580 -27 |
| 2022-23 | 7,253 -128 | 5,084 98 | 2,346 61 | 2,738 37 | 2,169 -226 | 757 -58 | 1,412 -168 |
| Average | 7,485 | 5,047 | 2,351 | 2,695 | 2,438 | 887 | 1,551 |