Student Population by Gender
Weber State University has a total of 29,914 enrolled students for the academic year 2022-2023. 28,903 students have enrolled in undergraduate programs and 1,011 students joined graduate programs.
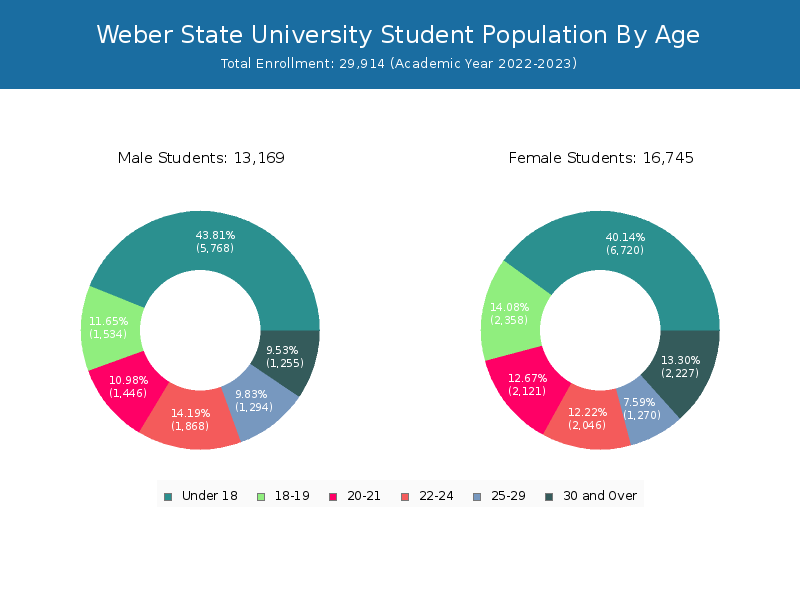
By gender, 13,169 male and 16,745 female students (the male-female ratio is 44:56) are attending the school. The gender distribution is based on the 2022-2023 data.
| Total | Undergraduate | Graduate | |
|---|---|---|---|
| Total | 29,914 | 28,903 | 1,011 |
| Men | 13,169 | 12,786 | 383 |
| Women | 16,745 | 16,117 | 628 |
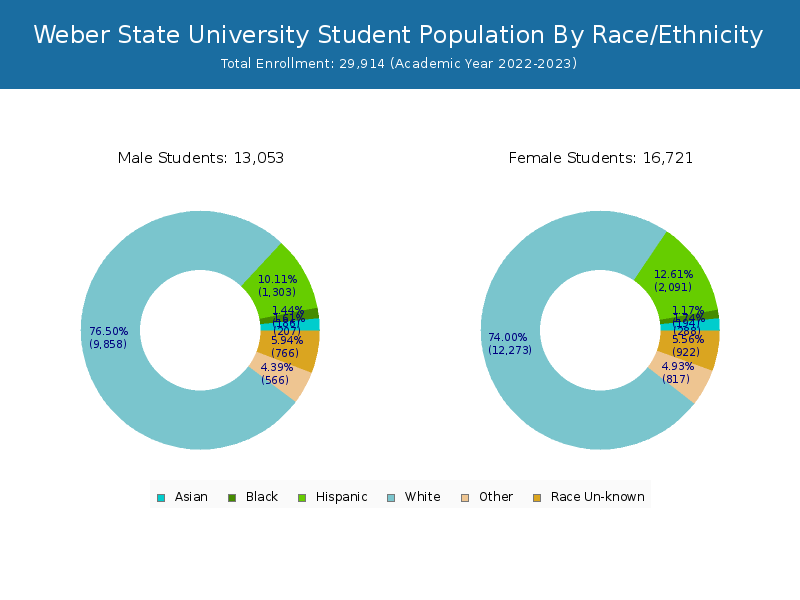
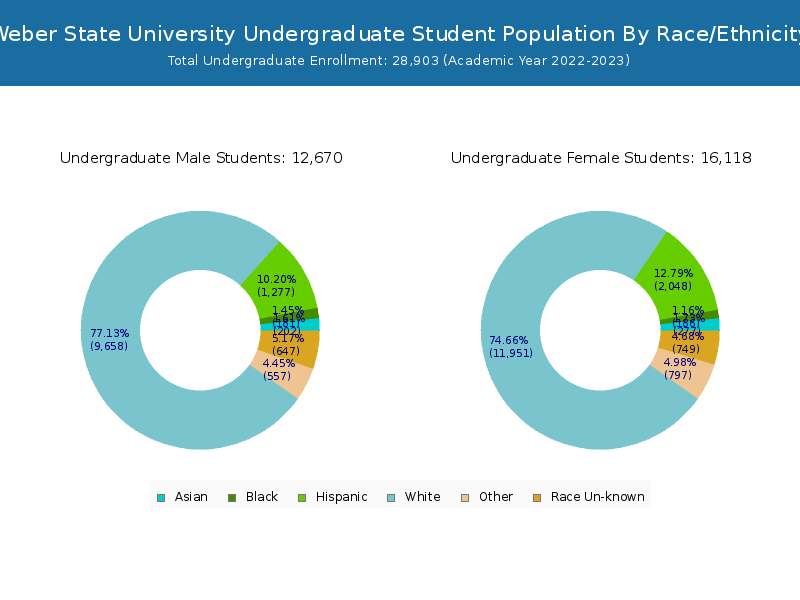
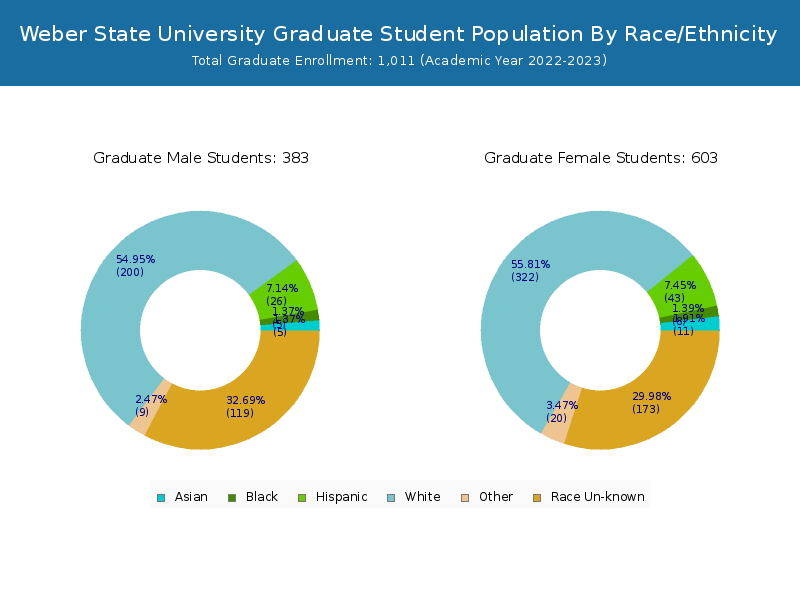
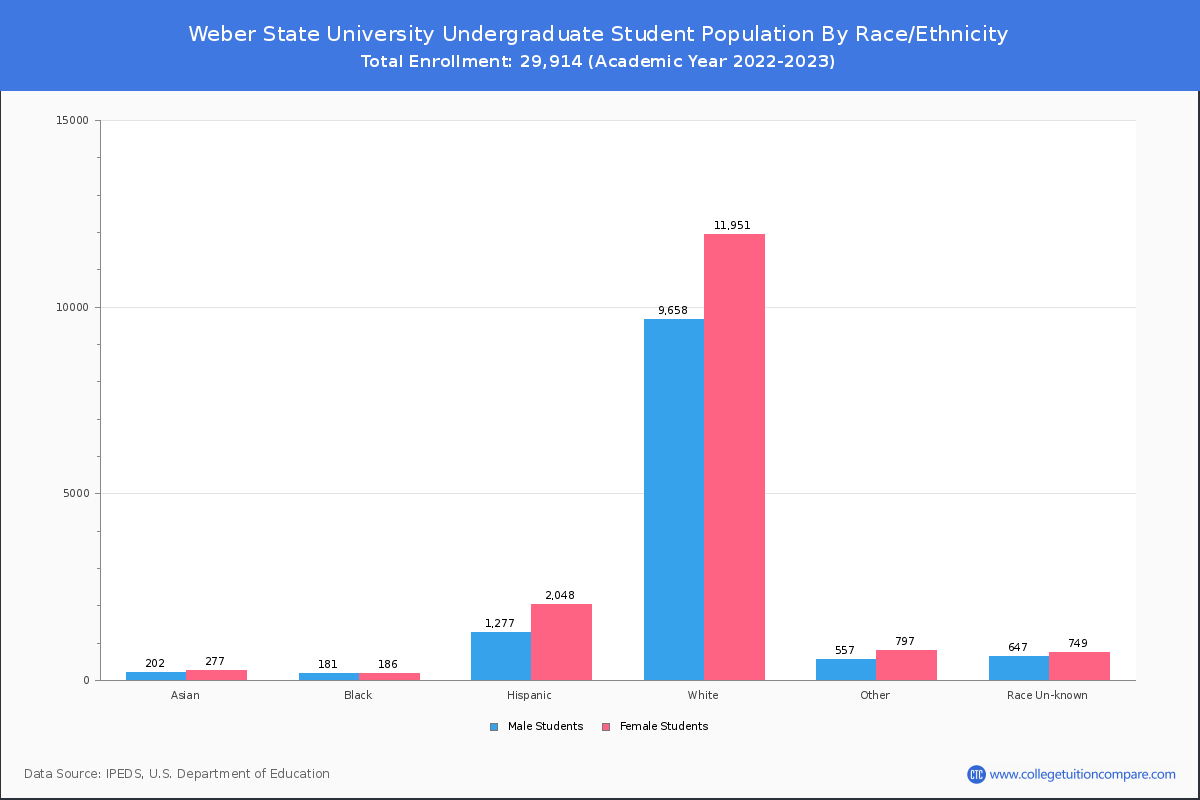
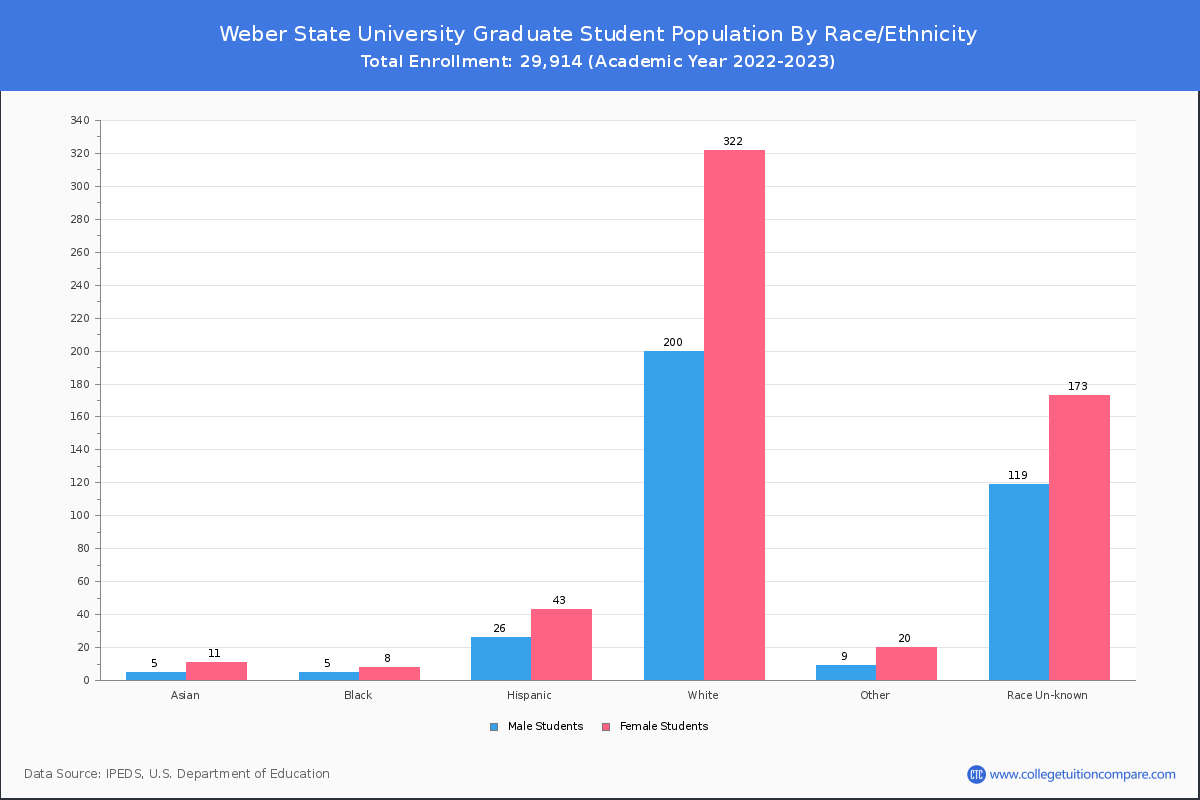
Student Distribution by Race/Ethnicity
By race/ethnicity, 22,090 White, 425 Black, and 541 Asian students out of a total of 29,914 are attending at Weber State University. Comprehensive enrollment statistic data by race/ethnicity is shown in the next chart (Academic year 2022-2023 data).

| Race | Total | Men | Women |
|---|---|---|---|
| American Indian or Native American | 127 | 45 | 82 |
| Asian | 541 | 228 | 313 |
| Black | 425 | 211 | 214 |
| Hispanic | 3,540 | 1,373 | 2,167 |
| Native Hawaiian or Other Pacific Islanders | 176 | 81 | 95 |
| White | 22,090 | 9,856 | 12,234 |
| Two or more races | 1,102 | 457 | 645 |
| Race Unknown | 1,584 | 745 | 839 |
| Race | Total | Men | Women |
|---|---|---|---|
| American Indian or Native American | 119 | 43 | 76 |
| Asian | 523 | 222 | 301 |
| Black | 410 | 206 | 204 |
| Hispanic | 3,446 | 1,337 | 2,109 |
| Native Hawaiian or Other Pacific Islanders | 172 | 80 | 92 |
| White | 21,453 | 9,619 | 11,834 |
| Two or more races | 1,079 | 449 | 630 |
| Race Unknown | 1,413 | 679 | 734 |
| Race | Total | Men | Women |
|---|---|---|---|
| American Indian or Native American | 8 | 1 | 7 |
| Asian | 25 | 11 | 14 |
| Black | 36 | 13 | 23 |
| Hispanic | 126 | 38 | 88 |
| Native Hawaiian or Other Pacific Islanders | 2 | 0 | 2 |
| White | 720 | 234 | 486 |
| Two or more races | 42 | 18 | 24 |
| Race Unknown | 27 | 12 | 15 |
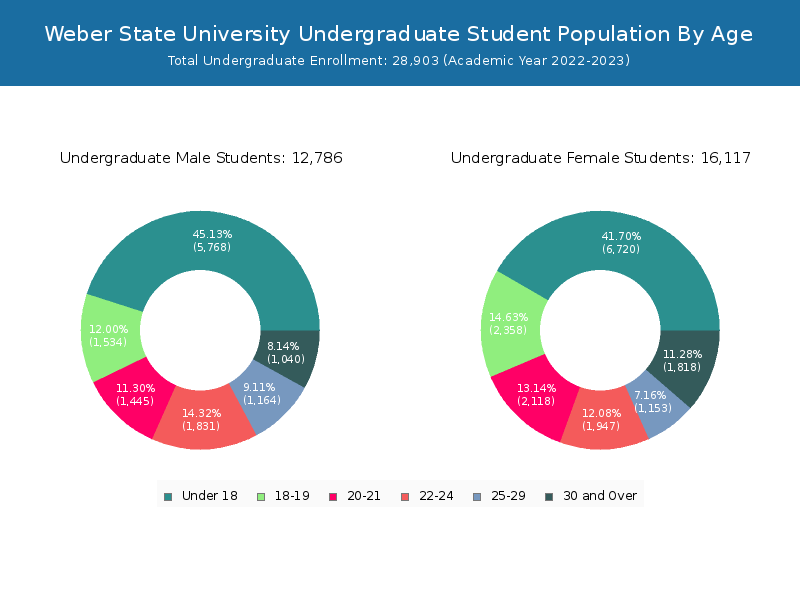
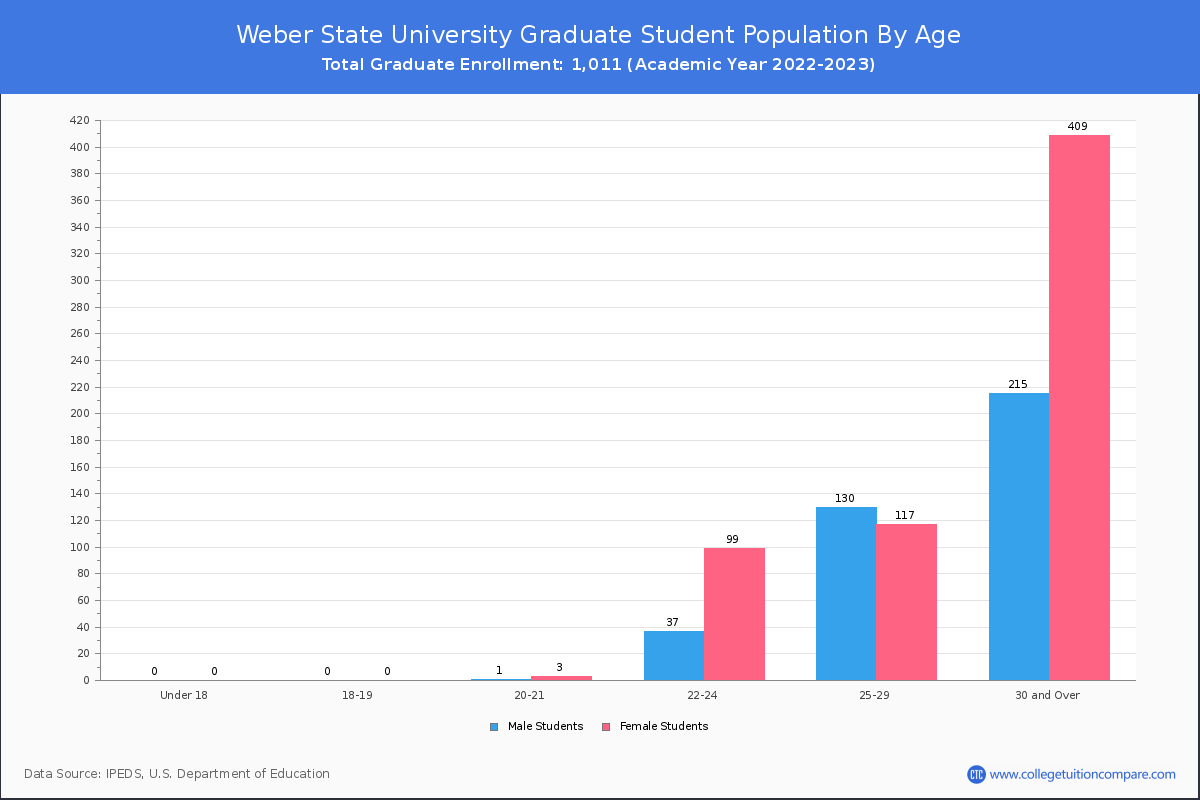
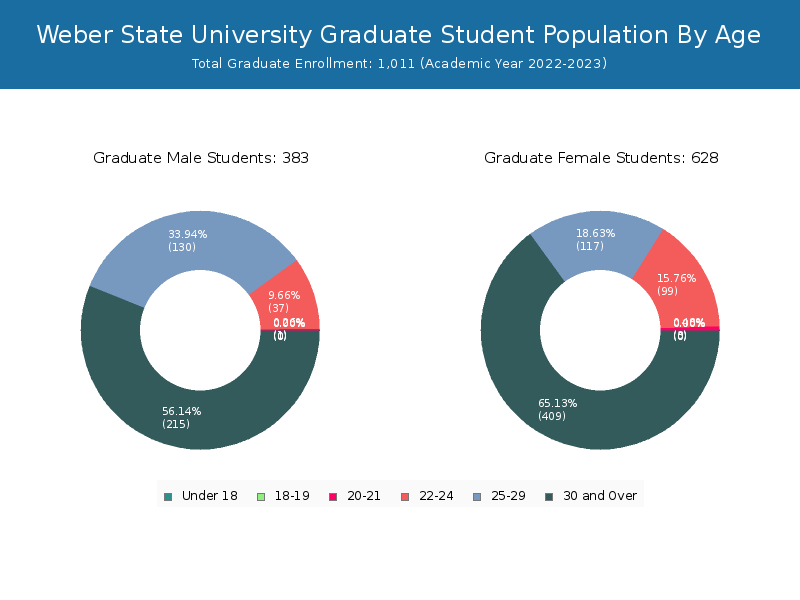
Student Age Distribution
By age, WSU has 12,488 students under 18 years old and 52 students over 65 years old. There are 23,861 students under 25 years old, and 6,046 students over 25 years old out of 29,914 total students.
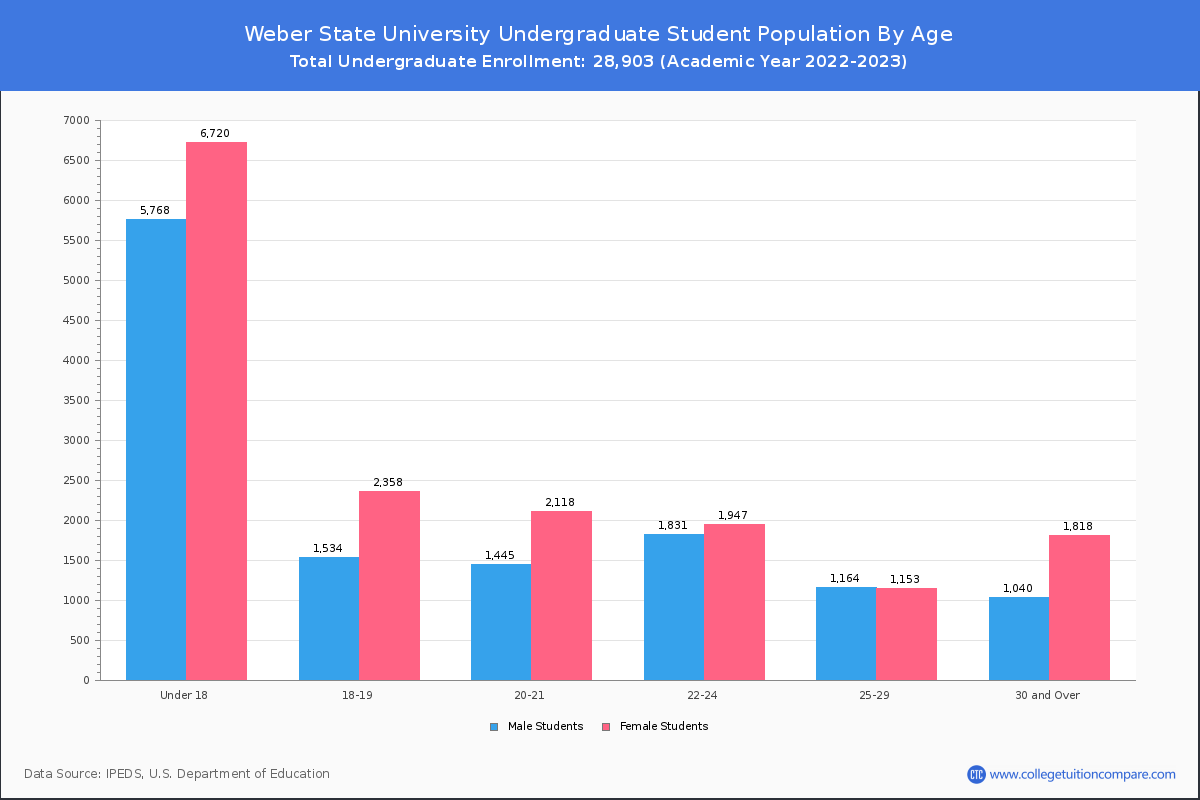
In undergraduate programs, 12,488 students are younger than 18 and 50 students are older than 65. WSU has 23,721 undergraduate students aged under 25 and 5,175 students aged 25 and over.
It has 140 graduate students aged under 25 and 871 students aged 25 and over.
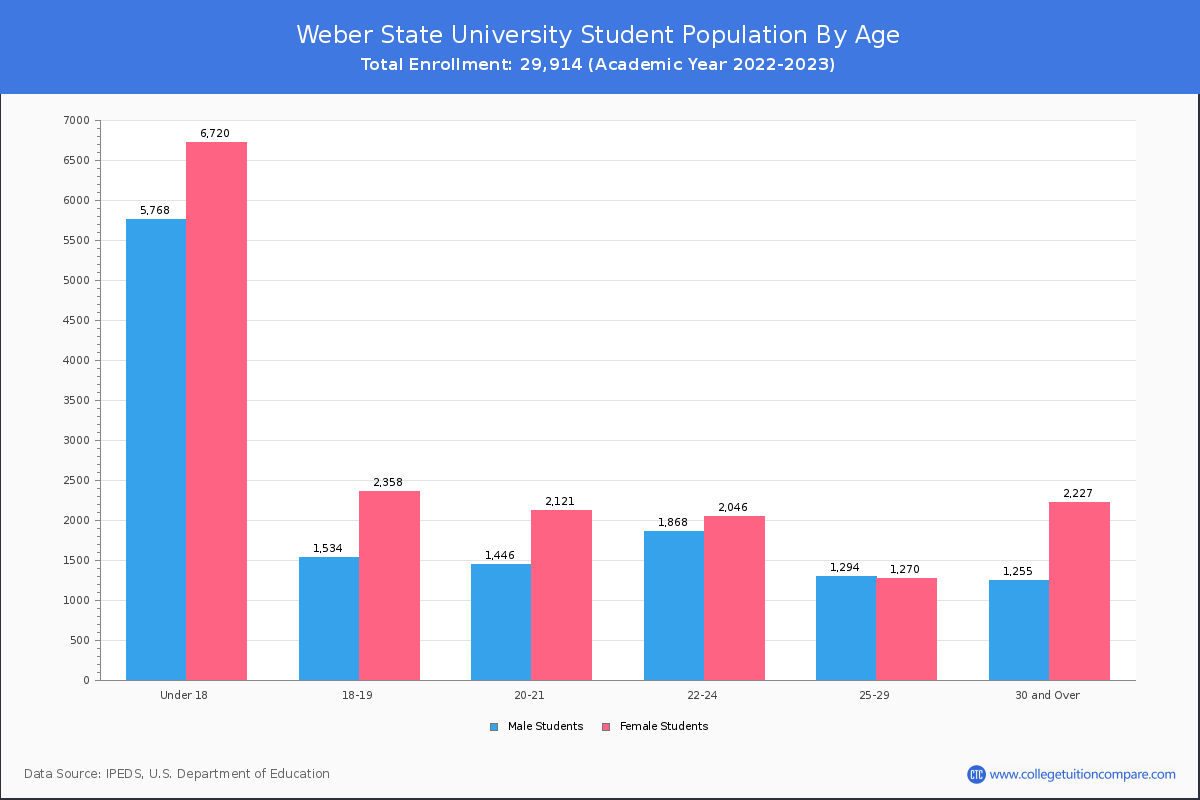
| Age | Total | Men | Women |
|---|---|---|---|
| Under 18 | 12,488 | 6,720 | 5,768 |
| 18-19 | 3,892 | 2,358 | 1,534 |
| 20-21 | 3,567 | 2,121 | 1,446 |
| 22-24 | 3,914 | 2,046 | 1,868 |
| 25-29 | 2,564 | 1,270 | 1,294 |
| 30-34 | 1,215 | 691 | 524 |
| 35-39 | 819 | 539 | 280 |
| 40-49 | 1,067 | 755 | 312 |
| 50-64 | 329 | 215 | 114 |
| Over 65 | 52 | 27 | 25 |
| Age | Total | Men | Women |
|---|---|---|---|
| Under 18 | 12,488 | 6,720 | 5,768 |
| 18-19 | 3,892 | 2,358 | 1,534 |
| 20-21 | 3,563 | 2,118 | 1,445 |
| 22-24 | 3,778 | 1,947 | 1,831 |
| 25-29 | 2,317 | 1,153 | 1,164 |
| 30-34 | 1,038 | 592 | 446 |
| 35-39 | 690 | 449 | 241 |
| 40-49 | 829 | 588 | 241 |
| 50-64 | 251 | 164 | 87 |
| Over 65 | 50 | 25 | 25 |
| Age | Total | Men | Women |
|---|
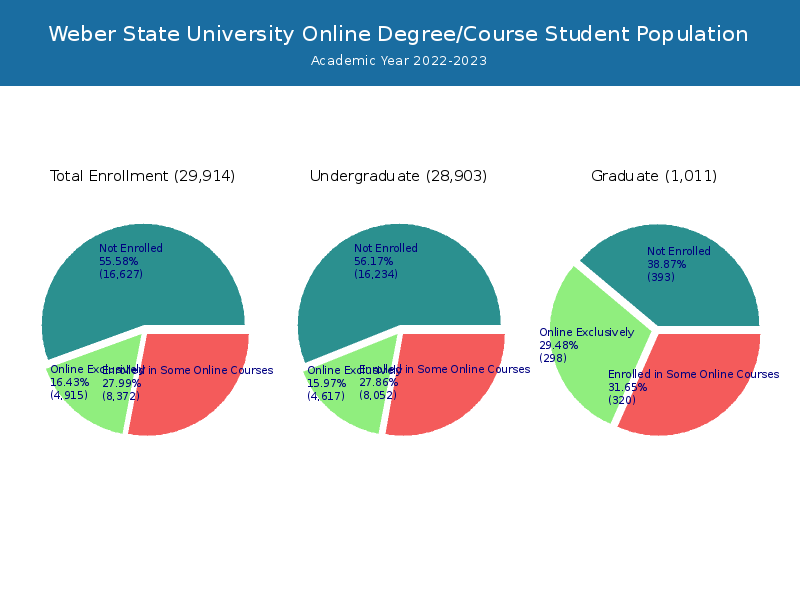
Online Student Enrollment
Distance learning, also called online education, is very attractive to students, especially who want to continue education and work in field. At Weber State University, 4,915 students are enrolled exclusively in online courses and 8,372 students are enrolled in some online courses.
4,268 students lived in Utah or jurisdiction in which the school is located are enrolled exclusively in online courses and 647 students live in other State or outside of the United States.
| All Students | Enrolled Exclusively Online Courses | Enrolled in Some Online Courses | |
|---|---|---|---|
| All Students | 29,914 | 4,915 | 8,372 |
| Undergraduate | 28,903 | 4,617 | 8,052 |
| Graduate | 1,011 | 298 | 320 |
| Utah Residents | Other States in U.S. | Outside of U.S. | |
|---|---|---|---|
| All Students | 4,268 | 632 | 15 |
| Undergraduate | 4,006 | 596 | 15 |
| Graduate | 262 | 36 | 0 |
Transfer-in Students (Undergraduate)
Among 28,903 enrolled in undergraduate programs, 1,007 students have transferred-in from other institutions. The percentage of transfer-in students is 3.48%.599 students have transferred in as full-time status and 408 students transferred in as part-time status.
| Number of Students | |
|---|---|
| Regular Full-time | 10,949 |
| Transfer-in Full-time | 599 |
| Regular Part-time | 16,947 |
| Transfer-in Part-time | 408 |