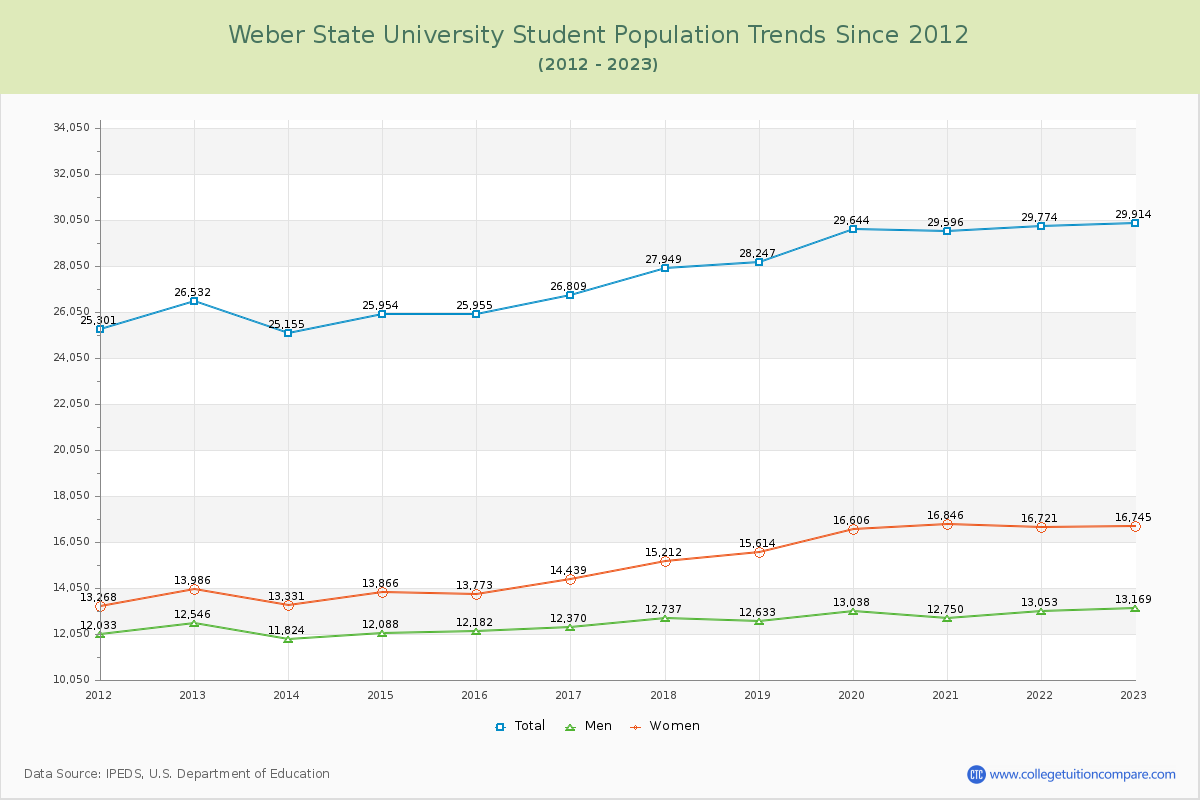
Student Population Changes
The average student population over the last 12 years is 27,775 where 29,914 students are attending the school for the academic year 2022-2023.
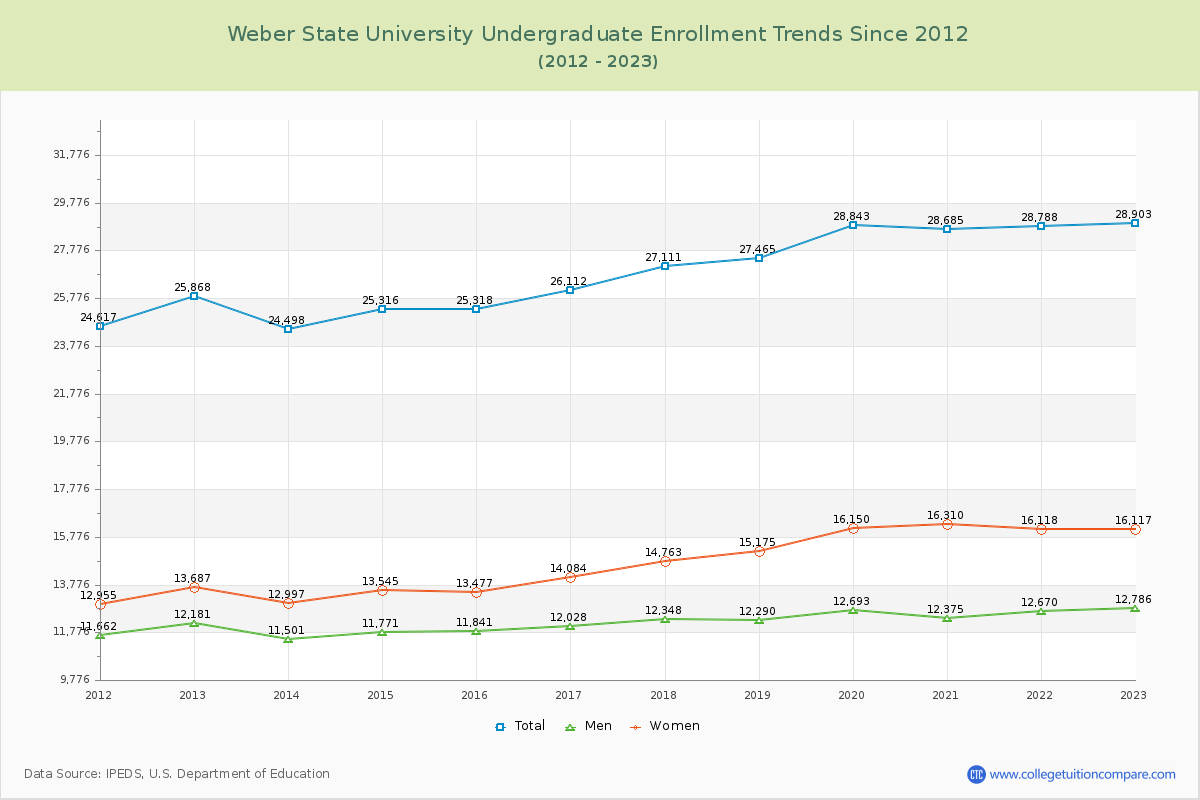
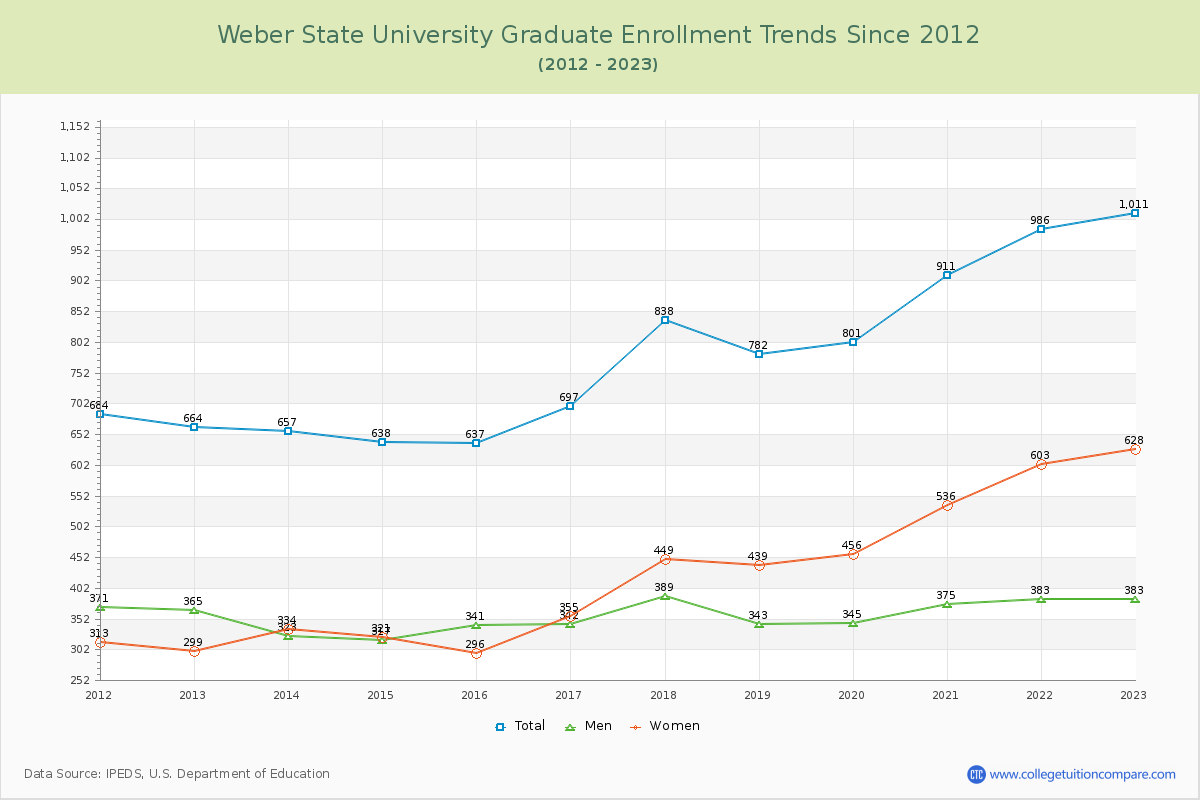
96.62% of total students is undergraduate students and 3.38% students is graduate students. The number of undergraduate students has increased by 3,035 and the graduate enrollment has increased by 347 over past 10 years.
The female to male ratio is 1.27 to 1 and it means that there are slightly more female students enrolled in WSU than male students.
The following table and chart illustrate the changes in student population by gender at Weber State University since 2012.
| Year | Total | Undergraduate | Graduate | ||||
|---|---|---|---|---|---|---|---|
| Total | Men | Women | Total | Men | Women | ||
| 2012-13 | 26,532 | 25,868 | 12,181 | 13,687 | 664 | 365 | 299 |
| 2013-14 | 25,155 -1,377 | 24,498 -1,370 | 11,501 -680 | 12,997 -690 | 657 -7 | 323 -42 | 334 35 |
| 2014-15 | 25,954 799 | 25,316 818 | 11,771 270 | 13,545 548 | 638 -19 | 317 -6 | 321 -13 |
| 2015-16 | 25,955 1 | 25,318 2 | 11,841 70 | 13,477 -68 | 637 -1 | 341 24 | 296 -25 |
| 2016-17 | 26,809 854 | 26,112 794 | 12,028 187 | 14,084 607 | 697 60 | 342 1 | 355 59 |
| 2017-18 | 27,949 1,140 | 27,111 999 | 12,348 320 | 14,763 679 | 838 141 | 389 47 | 449 94 |
| 2018-19 | 28,247 298 | 27,465 354 | 12,290 -58 | 15,175 412 | 782 -56 | 343 -46 | 439 -10 |
| 2019-20 | 29,644 1,397 | 28,843 1,378 | 12,693 403 | 16,150 975 | 801 19 | 345 2 | 456 17 |
| 2020-21 | 29,596 -48 | 28,685 -158 | 12,375 -318 | 16,310 160 | 911 110 | 375 30 | 536 80 |
| 2021-22 | 29,774 178 | 28,788 103 | 12,670 295 | 16,118 -192 | 986 75 | 383 8 | 603 67 |
| 2022-23 | 29,914 140 | 28,903 115 | 12,786 116 | 16,117 -1 | 1,011 25 | 383 0 | 628 25 |
| Average | 27,775 | 26,992 | 12,226 | 14,766 | 784 | 355 | 429 |