Student Population by Gender
Sul Ross State University has a total of 1,987 enrolled students for the academic year 2022-2023. 1,550 students have enrolled in undergraduate programs and 437 students joined graduate programs.
By gender, 794 male and 1,193 female students (the male-female ratio is 40:60) are attending the school. The gender distribution is based on the 2022-2023 data.
| Total | Undergraduate | Graduate | |
|---|---|---|---|
| Total | 1,987 | 1,550 | 437 |
| Men | 794 | 650 | 144 |
| Women | 1,193 | 900 | 293 |
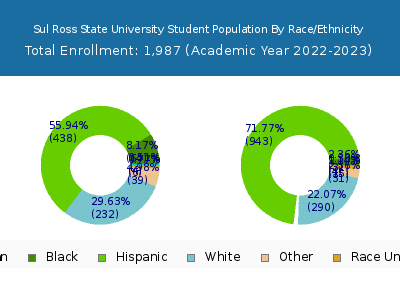
Student Distribution by Race/Ethnicity
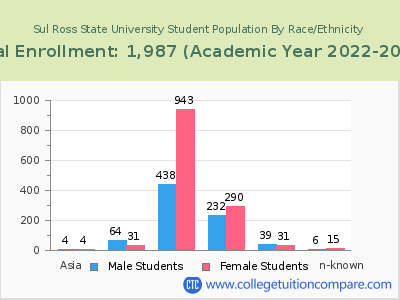
| Race | Total | Men | Women |
|---|---|---|---|
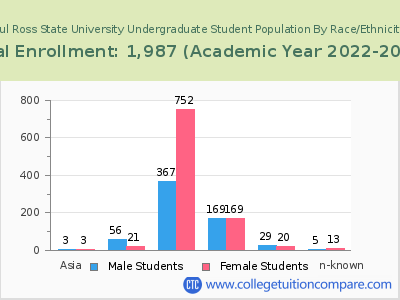
| American Indian or Native American | 12 | 4 | 8 |
| Asian | 6 | 3 | 3 |
| Black | 121 | 93 | 28 |
| Hispanic | 1,327 | 440 | 887 |
| Native Hawaiian or Other Pacific Islanders | 2 | 2 | 0 |
| White | 474 | 224 | 250 |
| Two or more races | 28 | 17 | 11 |
| Race Unknown | 14 | 9 | 5 |
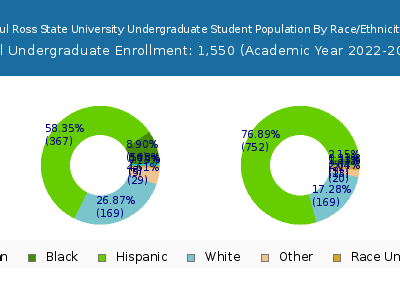
| Race | Total | Men | Women |
|---|---|---|---|
| American Indian or Native American | 9 | 2 | 7 |
| Asian | 5 | 2 | 3 |
| Black | 100 | 84 | 16 |
| Hispanic | 1,074 | 372 | 702 |
| Native Hawaiian or Other Pacific Islanders | 2 | 2 | 0 |
| White | 325 | 165 | 160 |
| Two or more races | 22 | 14 | 8 |
| Race Unknown | 12 | 8 | 4 |
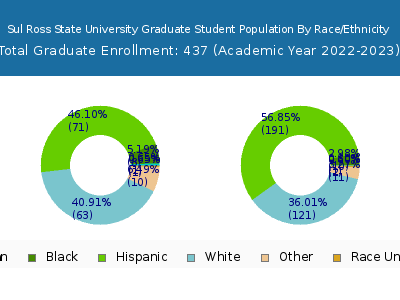
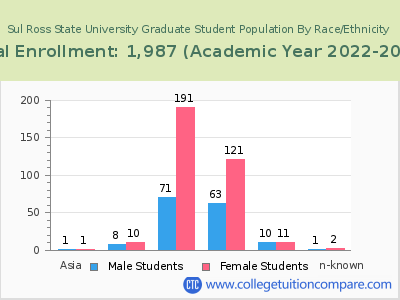
| Race | Total | Men | Women |
|---|---|---|---|
| American Indian or Native American | 1 | 0 | 1 |
| Asian | 1 | 1 | 0 |
| Black | 18 | 15 | 3 |
| Hispanic | 160 | 54 | 106 |
| Native Hawaiian or Other Pacific Islanders | 0 | 0 | 0 |
| White | 56 | 27 | 29 |
| Two or more races | 1 | 0 | 1 |
| Race Unknown | 1 | 1 | 0 |
Student Age Distribution
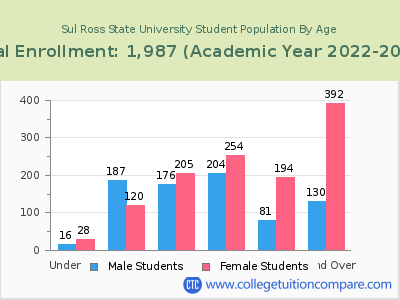
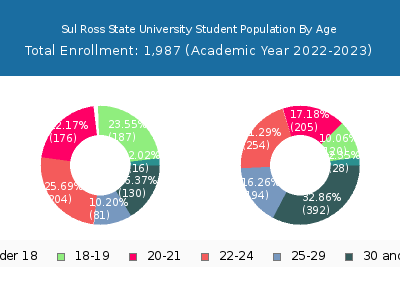
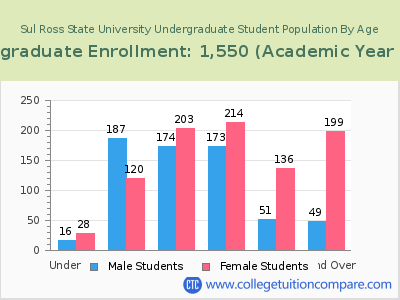
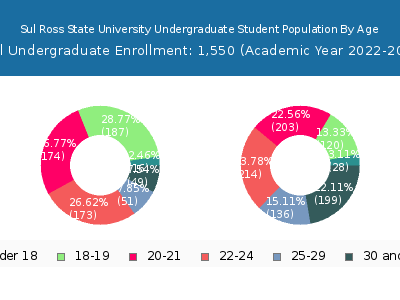
By age, Sul Ross has 44 students under 18 years old and 7 students over 65 years old. There are 1,190 students under 25 years old, and 797 students over 25 years old out of 1,987 total students.
In undergraduate programs, 44 students are younger than 18 and 3 students are older than 65. Sul Ross has 1,115 undergraduate students aged under 25 and 435 students aged 25 and over.
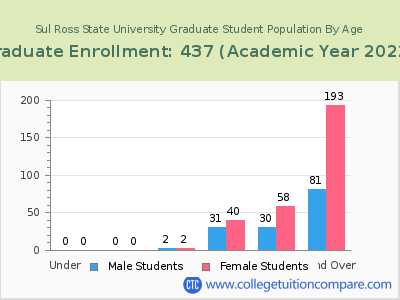
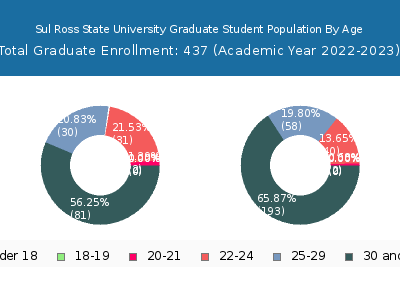
It has 75 graduate students aged under 25 and 362 students aged 25 and over.
| Age | Total | Men | Women |
|---|---|---|---|
| Under 18 | 44 | 28 | 16 |
| 18-19 | 307 | 120 | 187 |
| 20-21 | 381 | 205 | 176 |
| 22-24 | 458 | 254 | 204 |
| 25-29 | 275 | 194 | 81 |
| 30-34 | 166 | 130 | 36 |
| 35-39 | 135 | 98 | 37 |
| 40-49 | 150 | 116 | 34 |
| 50-64 | 64 | 43 | 21 |
| Over 65 | 7 | 5 | 2 |
| Age | Total | Men | Women |
|---|---|---|---|
| Under 18 | 44 | 28 | 16 |
| 18-19 | 307 | 120 | 187 |
| 20-21 | 377 | 203 | 174 |
| 22-24 | 387 | 214 | 173 |
| 25-29 | 187 | 136 | 51 |
| 30-34 | 104 | 85 | 19 |
| 35-39 | 59 | 45 | 14 |
| 40-49 | 61 | 51 | 10 |
| 50-64 | 21 | 15 | 6 |
| Over 65 | 3 | 3 | 0 |
| Age | Total | Men | Women |
|---|
Online Student Enrollment
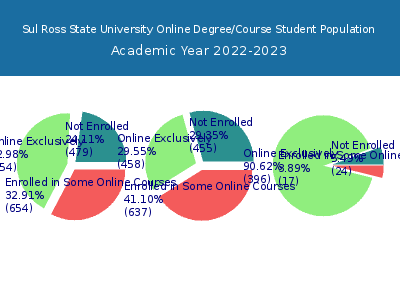
Distance learning, also called online education, is very attractive to students, especially who want to continue education and work in field. At Sul Ross State University, 854 students are enrolled exclusively in online courses and 654 students are enrolled in some online courses.
835 students lived in Texas or jurisdiction in which the school is located are enrolled exclusively in online courses and 19 students live in other State or outside of the United States.
| All Students | Enrolled Exclusively Online Courses | Enrolled in Some Online Courses | |
|---|---|---|---|
| All Students | 1,987 | 854 | 654 |
| Undergraduate | 1,550 | 458 | 637 |
| Graduate | 437 | 396 | 17 |
| Texas Residents | Other States in U.S. | Outside of U.S. | |
|---|---|---|---|
| All Students | 835 | 18 | 1 |
| Undergraduate | 451 | 6 | 1 |
| Graduate | 384 | 12 | 0 |
Transfer-in Students (Undergraduate)
Among 1,550 enrolled in undergraduate programs, 238 students have transferred-in from other institutions. The percentage of transfer-in students is 15.35%.132 students have transferred in as full-time status and 106 students transferred in as part-time status.
| Number of Students | |
|---|---|
| Regular Full-time | 786 |
| Transfer-in Full-time | 132 |
| Regular Part-time | 526 |
| Transfer-in Part-time | 106 |
