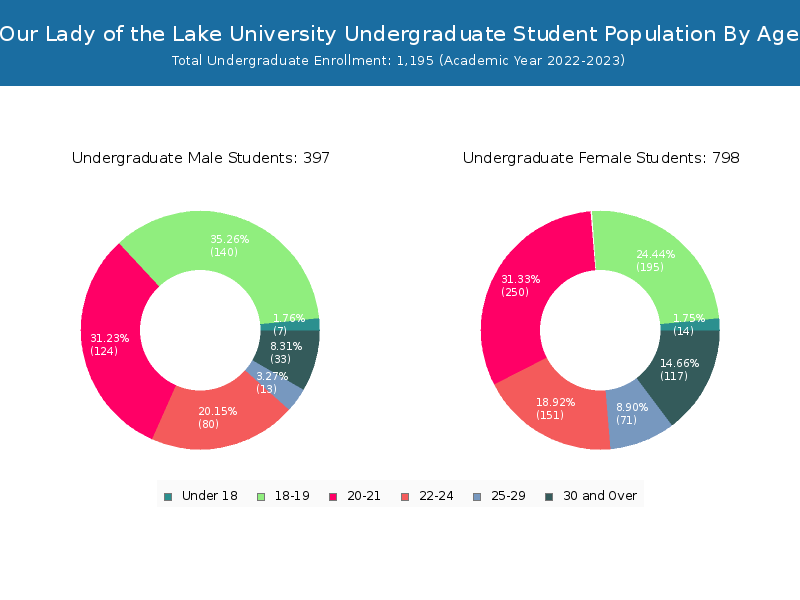
Student Population by Gender
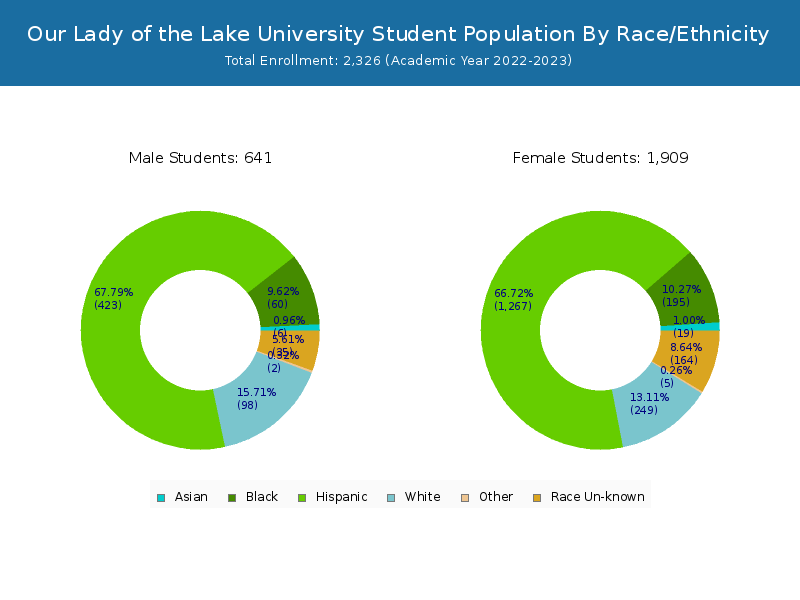
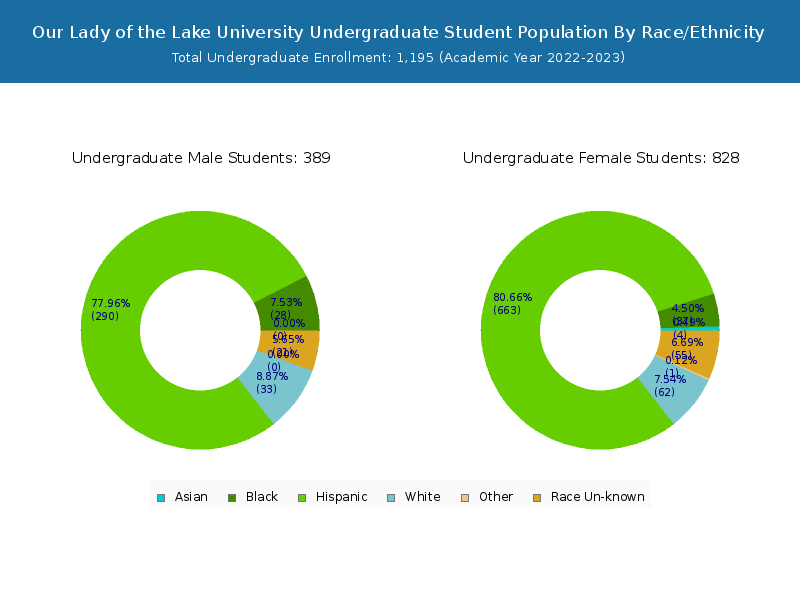
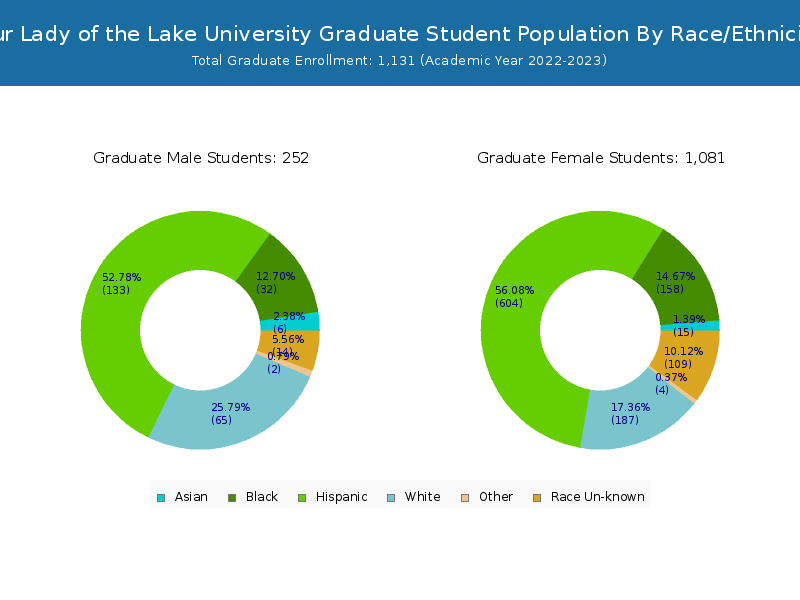
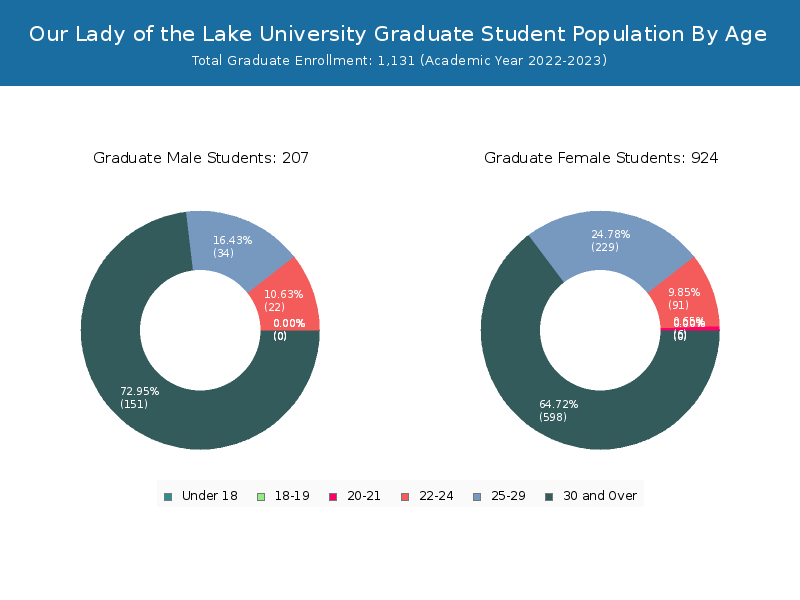
Our Lady of the Lake University has a total of 2,326 enrolled students for the academic year 2022-2023. 1,195 students have enrolled in undergraduate programs and 1,131 students joined graduate programs.
By gender, 604 male and 1,722 female students (the male-female ratio is 26:74) are attending the school. The gender distribution is based on the 2022-2023 data.
| Total | Undergraduate | Graduate | |
|---|---|---|---|
| Total | 2,326 | 1,195 | 1,131 |
| Men | 604 | 397 | 207 |
| Women | 1,722 | 798 | 924 |
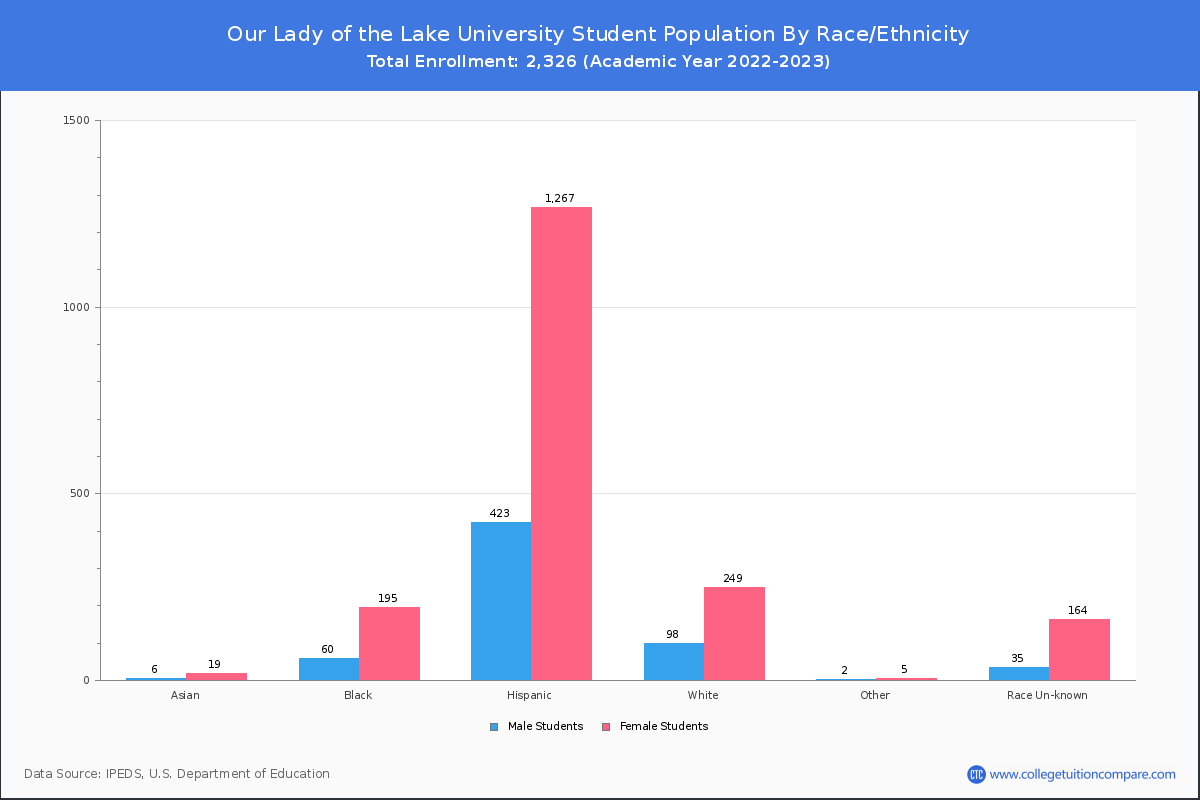
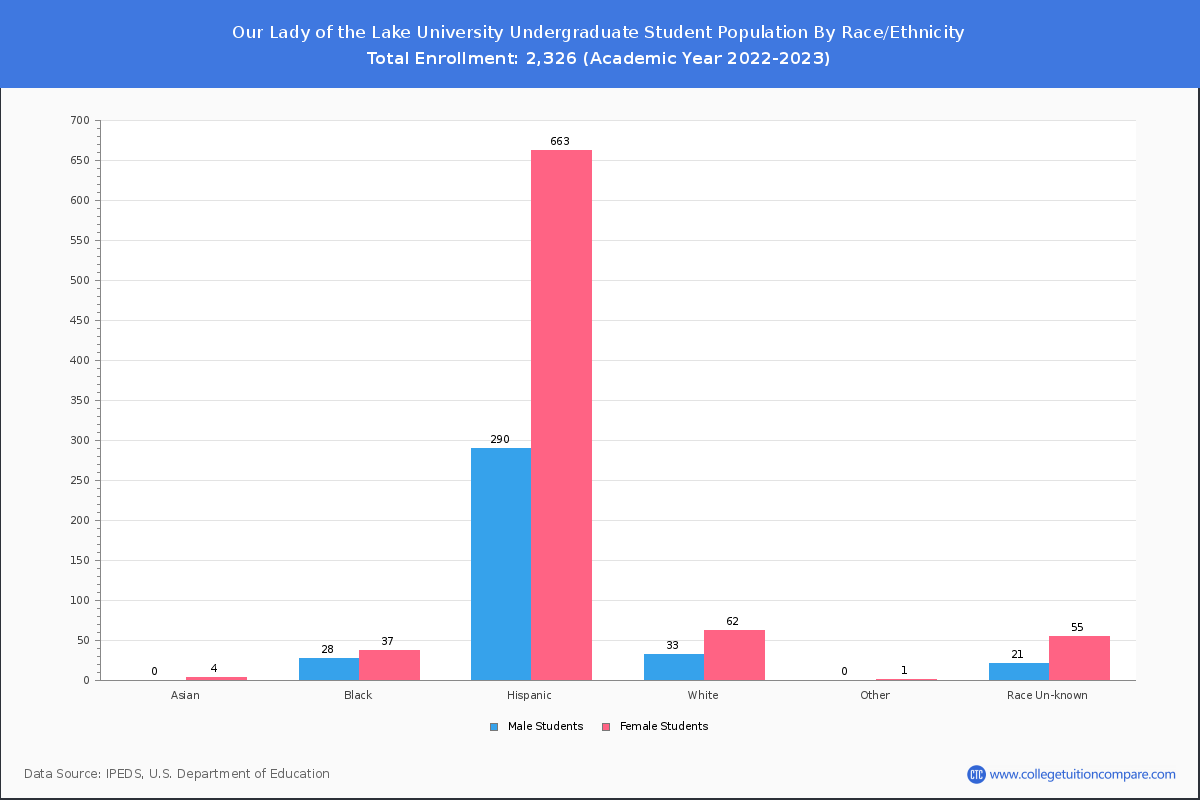
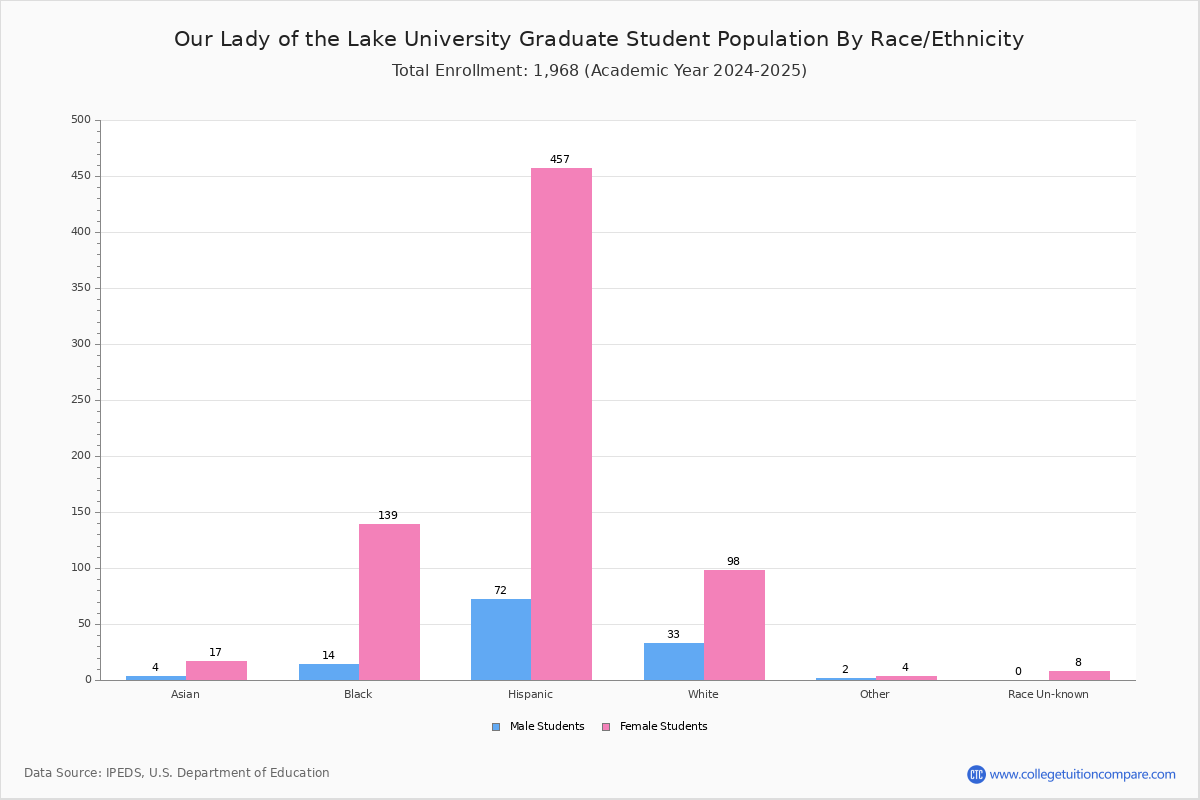
Student Distribution by Race/Ethnicity
By race/ethnicity, 340 White, 251 Black, and 24 Asian students out of a total of 2,326 are attending at Our Lady of the Lake University. Comprehensive enrollment statistic data by race/ethnicity is shown in the next chart (Academic year 2022-2023 data).
| Race | Total | Men | Women |
|---|---|---|---|
| American Indian or Native American | 2 | 1 | 1 |
| Asian | 24 | 4 | 20 |
| Black | 251 | 51 | 200 |
| Hispanic | 1,561 | 399 | 1,162 |
| Native Hawaiian or Other Pacific Islanders | 0 | 0 | 0 |
| White | 340 | 99 | 241 |
| Two or more races | 0 | 0 | 0 |
| Race Unknown | 116 | 30 | 86 |
| Race | Total | Men | Women |
|---|---|---|---|
| American Indian or Native American | 0 | 0 | 0 |
| Asian | 6 | 1 | 5 |
| Black | 80 | 29 | 51 |
| Hispanic | 906 | 289 | 617 |
| Native Hawaiian or Other Pacific Islanders | 0 | 0 | 0 |
| White | 96 | 34 | 62 |
| Two or more races | 0 | 0 | 0 |
| Race Unknown | 83 | 27 | 56 |
| Race | Total | Men | Women |
|---|---|---|---|
| American Indian or Native American | 0 | 0 | 0 |
| Asian | 1 | 0 | 1 |
| Black | 19 | 8 | 11 |
| Hispanic | 87 | 21 | 66 |
| Native Hawaiian or Other Pacific Islanders | 0 | 0 | 0 |
| White | 17 | 6 | 11 |
| Two or more races | 0 | 0 | 0 |
| Race Unknown | 3 | 2 | 1 |
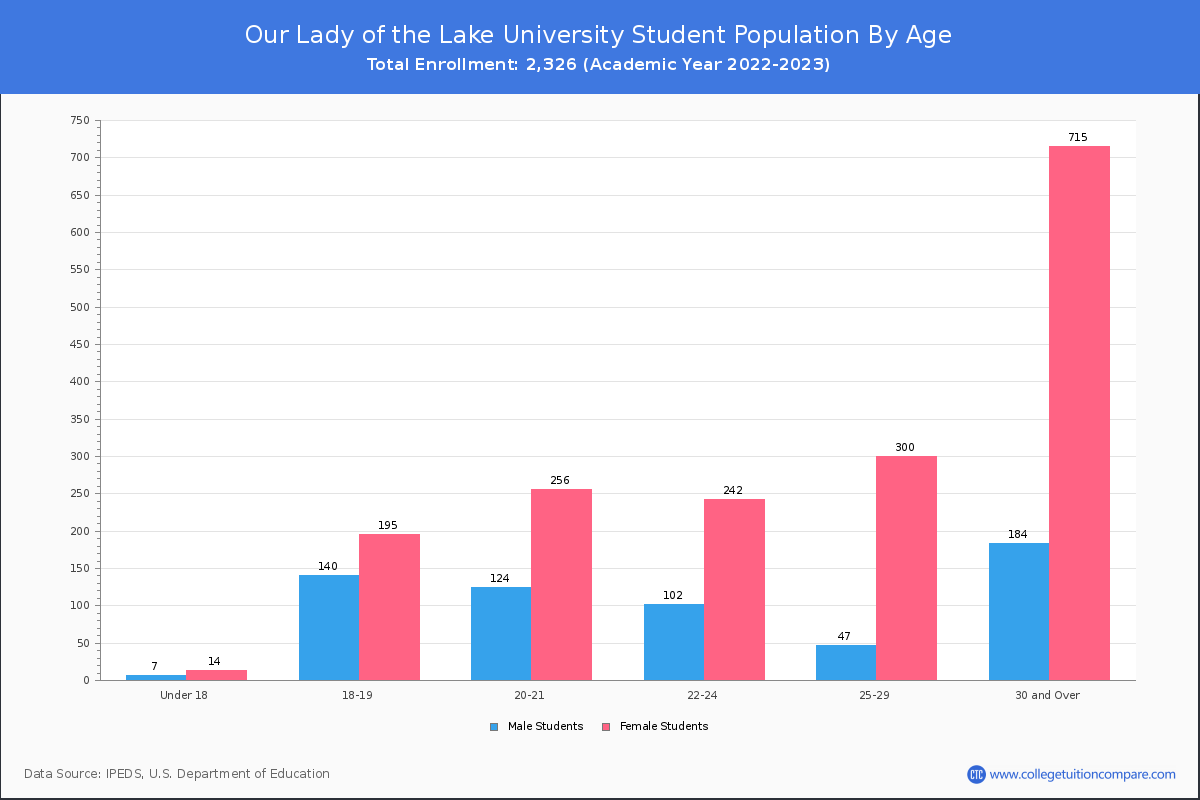
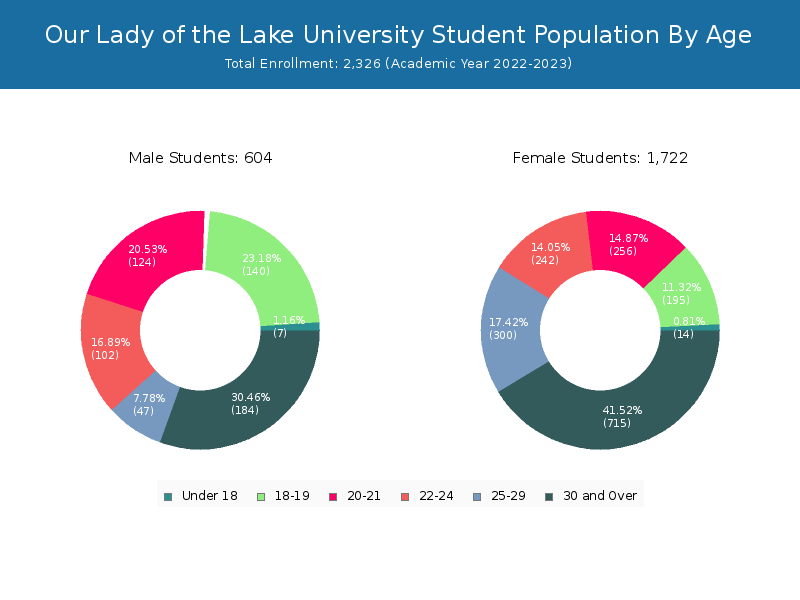
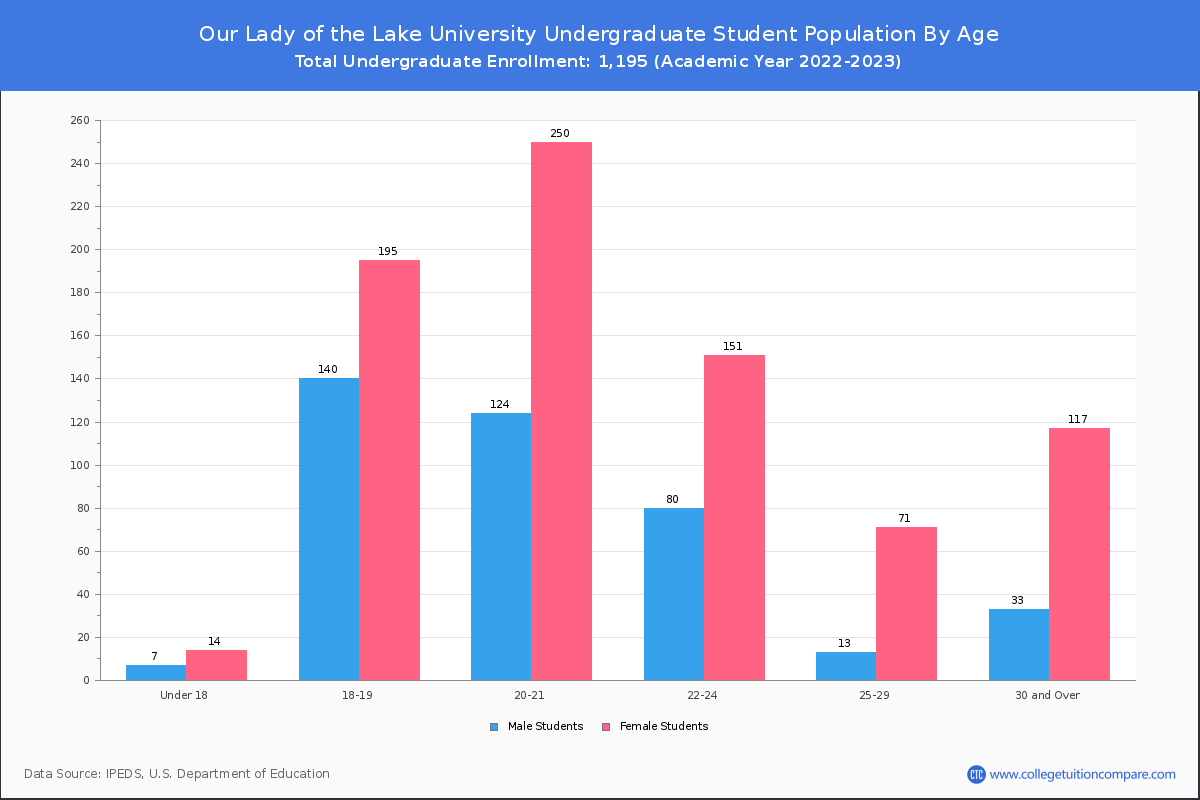
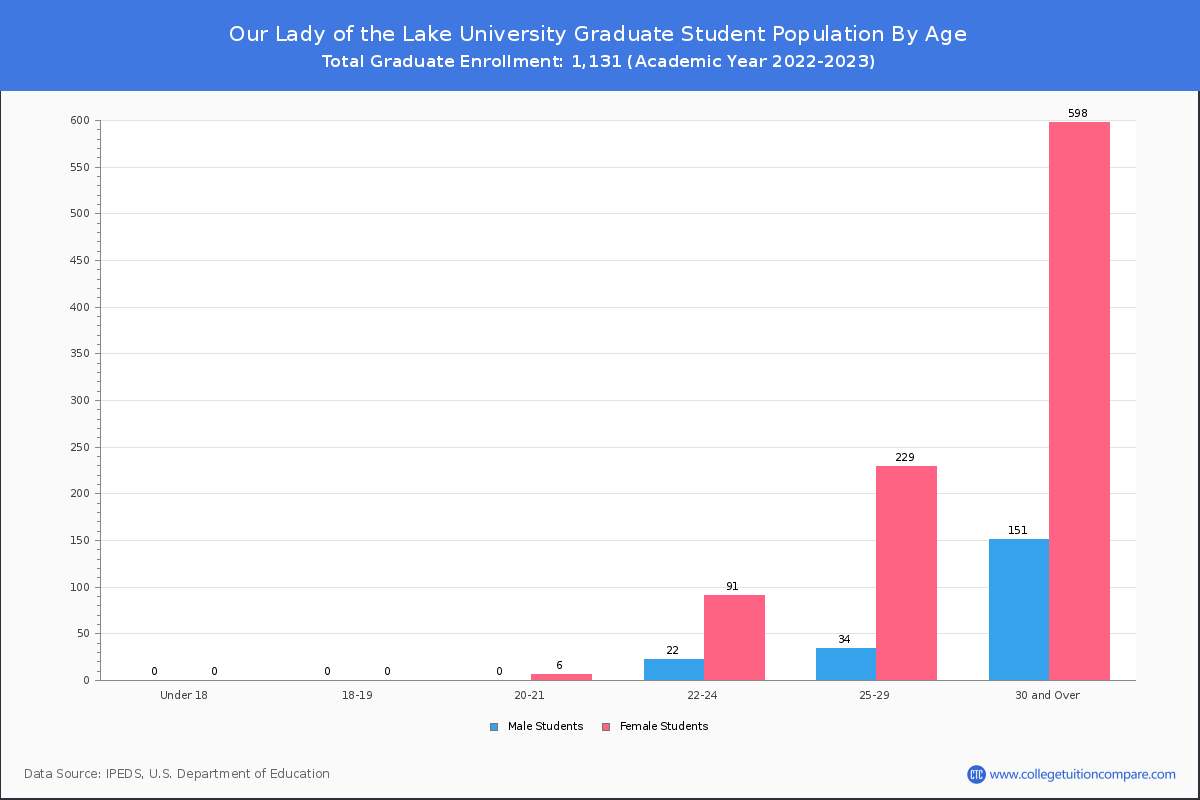
Student Age Distribution
By age, OLLU has 21 students under 18 years old and 4 students over 65 years old. There are 1,080 students under 25 years old, and 1,246 students over 25 years old out of 2,326 total students.
OLLU has 961 undergraduate students aged under 25 and 234 students aged 25 and over.
It has 119 graduate students aged under 25 and 1,012 students aged 25 and over.
| Age | Total | Men | Women |
|---|---|---|---|
| Under 18 | 21 | 14 | 7 |
| 18-19 | 335 | 195 | 140 |
| 20-21 | 380 | 256 | 124 |
| 22-24 | 344 | 242 | 102 |
| 25-29 | 347 | 300 | 47 |
| 30-34 | 259 | 207 | 52 |
| 35-39 | 191 | 157 | 34 |
| 40-49 | 308 | 246 | 62 |
| 50-64 | 137 | 104 | 33 |
| Over 65 | 4 | 1 | 3 |
| Age | Total | Men | Women |
|---|---|---|---|
| Under 18 | 21 | 14 | 7 |
| 18-19 | 335 | 195 | 140 |
| 20-21 | 374 | 250 | 124 |
| 22-24 | 231 | 151 | 80 |
| 25-29 | 84 | 71 | 13 |
| 30-34 | 44 | 32 | 12 |
| 35-39 | 37 | 32 | 5 |
| 40-49 | 47 | 37 | 10 |
| 50-64 | 22 | 16 | 6 |
| Age | Total | Men | Women |
|---|
Online Student Enrollment
Distance learning, also called online education, is very attractive to students, especially who want to continue education and work in field. At Our Lady of the Lake University, 792 students are enrolled exclusively in online courses and 723 students are enrolled in some online courses.
588 students lived in Texas or jurisdiction in which the school is located are enrolled exclusively in online courses and 204 students live in other State or outside of the United States.
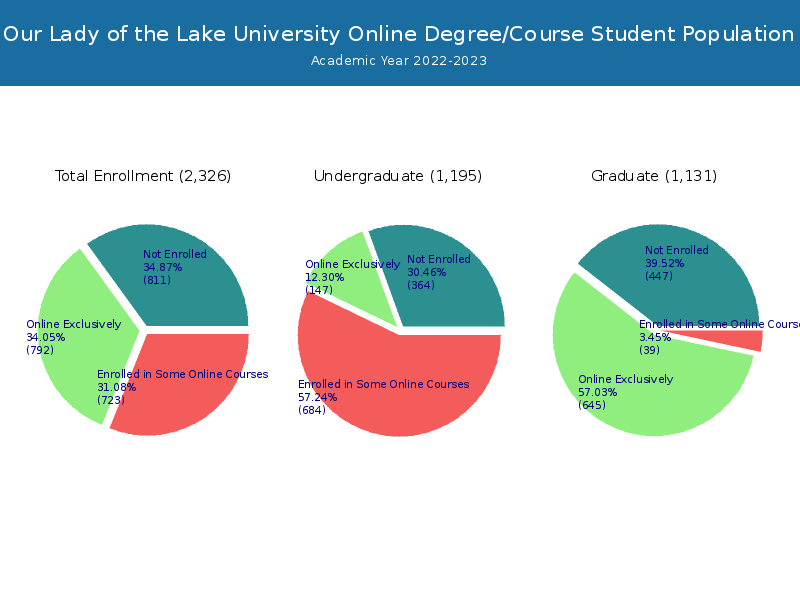
| All Students | Enrolled Exclusively Online Courses | Enrolled in Some Online Courses | |
|---|---|---|---|
| All Students | 2,326 | 792 | 723 |
| Undergraduate | 1,195 | 147 | 684 |
| Graduate | 1,131 | 645 | 39 |
| Texas Residents | Other States in U.S. | Outside of U.S. | |
|---|---|---|---|
| All Students | 588 | 204 | 0 |
| Undergraduate | 129 | 18 | 0 |
| Graduate | 459 | 186 | 0 |
Transfer-in Students (Undergraduate)
Among 1,195 enrolled in undergraduate programs, 129 students have transferred-in from other institutions. The percentage of transfer-in students is 10.79%.112 students have transferred in as full-time status and 17 students transferred in as part-time status.
| Number of Students | |
|---|---|
| Regular Full-time | 925 |
| Transfer-in Full-time | 112 |
| Regular Part-time | 141 |
| Transfer-in Part-time | 17 |