Student Population by Gender
Salve Regina University has a total of 2,872 enrolled students for the academic year 2022-2023. 2,190 students have enrolled in undergraduate programs and 682 students joined graduate programs.
By gender, 914 male and 1,958 female students (the male-female ratio is 32:68) are attending the school. The gender distribution is based on the 2022-2023 data.
| Total | Undergraduate | Graduate | |
|---|---|---|---|
| Total | 2,872 | 2,190 | 682 |
| Men | 914 | 679 | 235 |
| Women | 1,958 | 1,511 | 447 |
Student Distribution by Race/Ethnicity
| Race | Total | Men | Women |
|---|---|---|---|
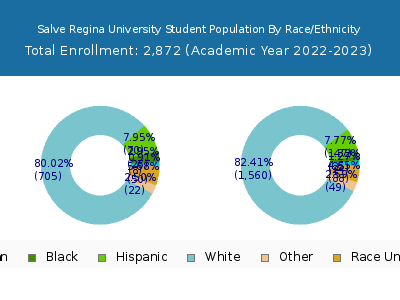
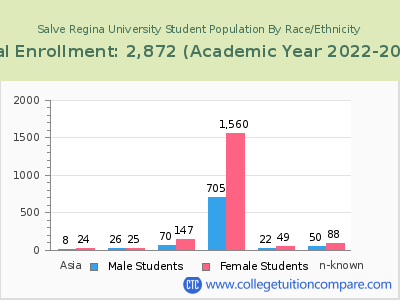
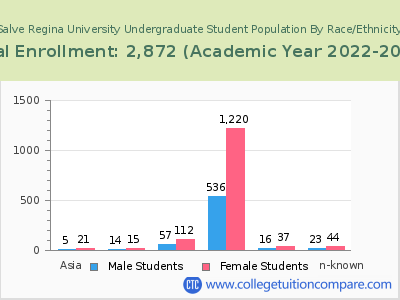
| American Indian or Native American | 3 | 2 | 1 |
| Asian | 29 | 7 | 22 |
| Black | 64 | 26 | 38 |
| Hispanic | 242 | 79 | 163 |
| Native Hawaiian or Other Pacific Islanders | 5 | 2 | 3 |
| White | 2,256 | 677 | 1,579 |
| Two or more races | 76 | 27 | 49 |
| Race Unknown | 132 | 53 | 79 |
| Race | Total | Men | Women |
|---|---|---|---|
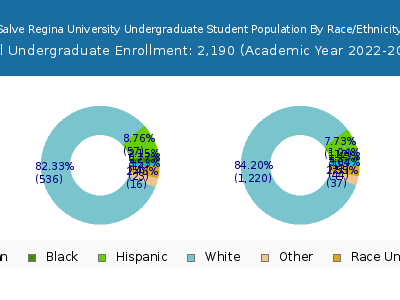
| American Indian or Native American | 1 | 1 | 0 |
| Asian | 28 | 6 | 22 |
| Black | 33 | 14 | 19 |
| Hispanic | 197 | 65 | 132 |
| Native Hawaiian or Other Pacific Islanders | 3 | 1 | 2 |
| White | 1,737 | 510 | 1,227 |
| Two or more races | 61 | 20 | 41 |
| Race Unknown | 71 | 25 | 46 |
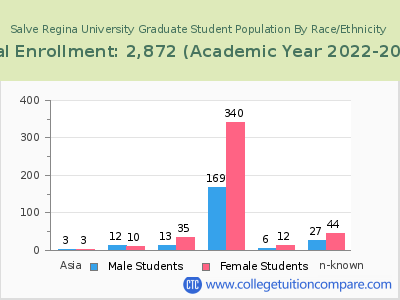
| Race | Total | Men | Women |
|---|---|---|---|
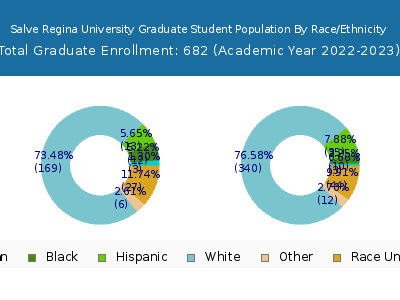
| American Indian or Native American | 0 | 0 | 0 |
| Asian | 0 | 0 | 0 |
| Black | 4 | 1 | 3 |
| Hispanic | 4 | 2 | 2 |
| Native Hawaiian or Other Pacific Islanders | 0 | 0 | 0 |
| White | 22 | 8 | 14 |
| Two or more races | 0 | 0 | 0 |
| Race Unknown | 14 | 6 | 8 |
Student Age Distribution
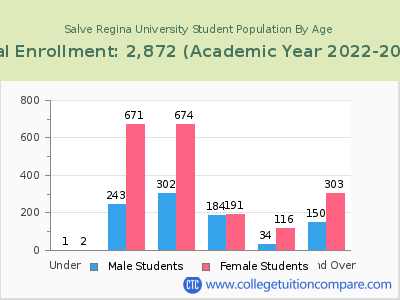
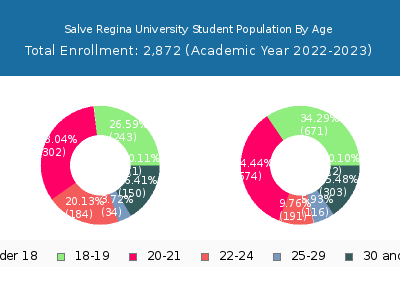
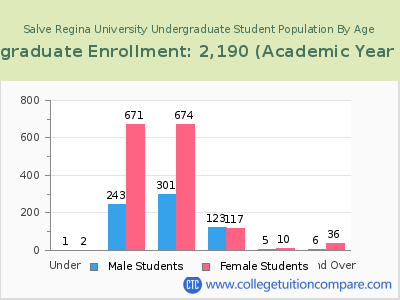
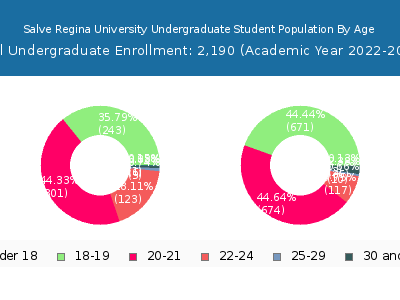
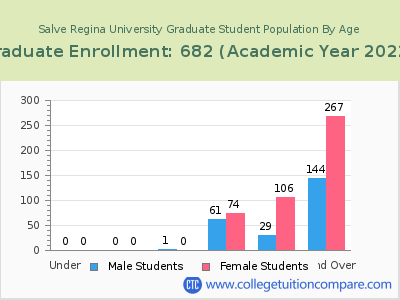
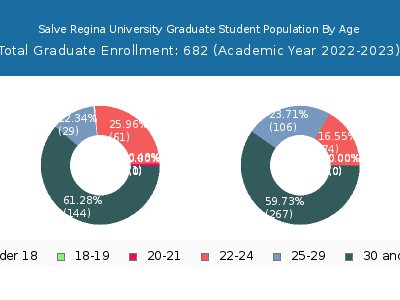
By age, Salve Regina has 3 students under 18 years old and 10 students over 65 years old. There are 2,268 students under 25 years old, and 603 students over 25 years old out of 2,872 total students.
Salve Regina has 2,132 undergraduate students aged under 25 and 57 students aged 25 and over.
It has 136 graduate students aged under 25 and 546 students aged 25 and over.
| Age | Total | Men | Women |
|---|---|---|---|
| Under 18 | 3 | 2 | 1 |
| 18-19 | 914 | 671 | 243 |
| 20-21 | 976 | 674 | 302 |
| 22-24 | 375 | 191 | 184 |
| 25-29 | 150 | 116 | 34 |
| 30-34 | 95 | 69 | 26 |
| 35-39 | 91 | 57 | 34 |
| 40-49 | 152 | 105 | 47 |
| 50-64 | 105 | 65 | 40 |
| Over 65 | 10 | 7 | 3 |
| Age | Total | Men | Women |
|---|---|---|---|
| Under 18 | 3 | 2 | 1 |
| 18-19 | 914 | 671 | 243 |
| 20-21 | 975 | 674 | 301 |
| 22-24 | 240 | 117 | 123 |
| 25-29 | 15 | 10 | 5 |
| 30-34 | 12 | 10 | 2 |
| 35-39 | 11 | 8 | 3 |
| 40-49 | 12 | 12 | 0 |
| 50-64 | 7 | 6 | 1 |
| Age | Total | Men | Women |
|---|
Online Student Enrollment
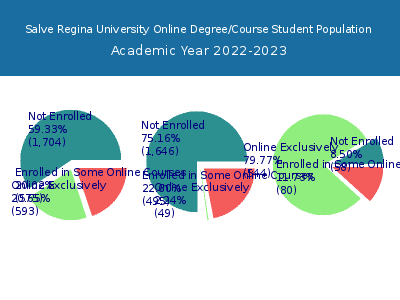
Distance learning, also called online education, is very attractive to students, especially who want to continue education and work in field. At Salve Regina University, 593 students are enrolled exclusively in online courses and 575 students are enrolled in some online courses.
310 students lived in Rhode Island or jurisdiction in which the school is located are enrolled exclusively in online courses and 283 students live in other State or outside of the United States.
| All Students | Enrolled Exclusively Online Courses | Enrolled in Some Online Courses | |
|---|---|---|---|
| All Students | 2,872 | 593 | 575 |
| Undergraduate | 2,190 | 49 | 495 |
| Graduate | 682 | 544 | 80 |
| Rhode Island Residents | Other States in U.S. | Outside of U.S. | |
|---|---|---|---|
| All Students | 310 | 281 | 2 |
| Undergraduate | 19 | 29 | 1 |
| Graduate | 291 | 252 | 1 |
Transfer-in Students (Undergraduate)
Among 2,190 enrolled in undergraduate programs, 46 students have transferred-in from other institutions. The percentage of transfer-in students is 2.10%.39 students have transferred in as full-time status and 7 students transferred in as part-time status.
| Number of Students | |
|---|---|
| Regular Full-time | 2,089 |
| Transfer-in Full-time | 39 |
| Regular Part-time | 55 |
| Transfer-in Part-time | 7 |
