Student Population by Gender
The College of Wooster has a total of 1,967 enrolled students for the academic year 2022-2023. All 1,967 students are enrolled into undergraduate programs.
By gender, 955 male and 1,012 female students (the male-female ratio is 49:51) are attending the school. The gender distribution is based on the 2022-2023 data.
| Undergraduate | |
|---|---|
| Total | 1,967 |
| Men | 955 |
| Women | 1,012 |
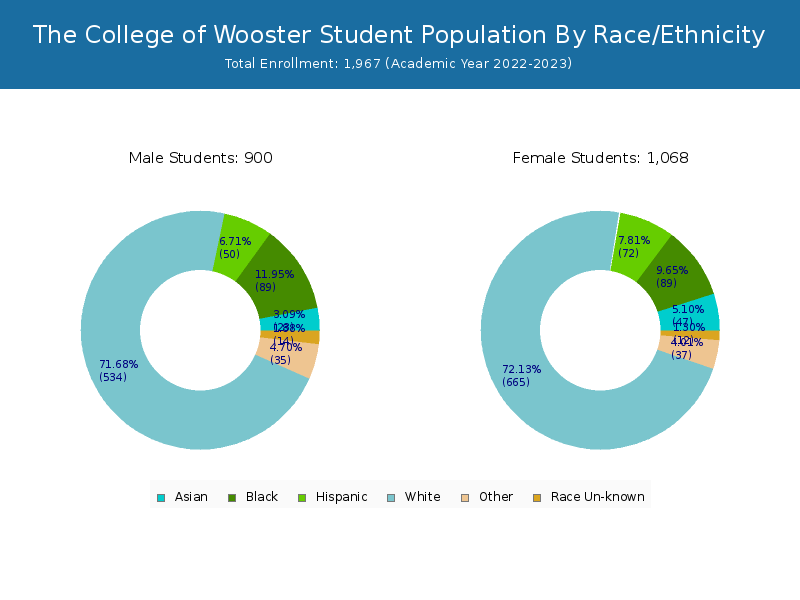
Student Distribution by Race/Ethnicity
By race/ethnicity, 1,172 White, 188 Black, and 79 Asian students out of a total of 1,967 are attending at The College of Wooster. Comprehensive enrollment statistic data by race/ethnicity is shown in the next chart (Academic year 2022-2023 data).
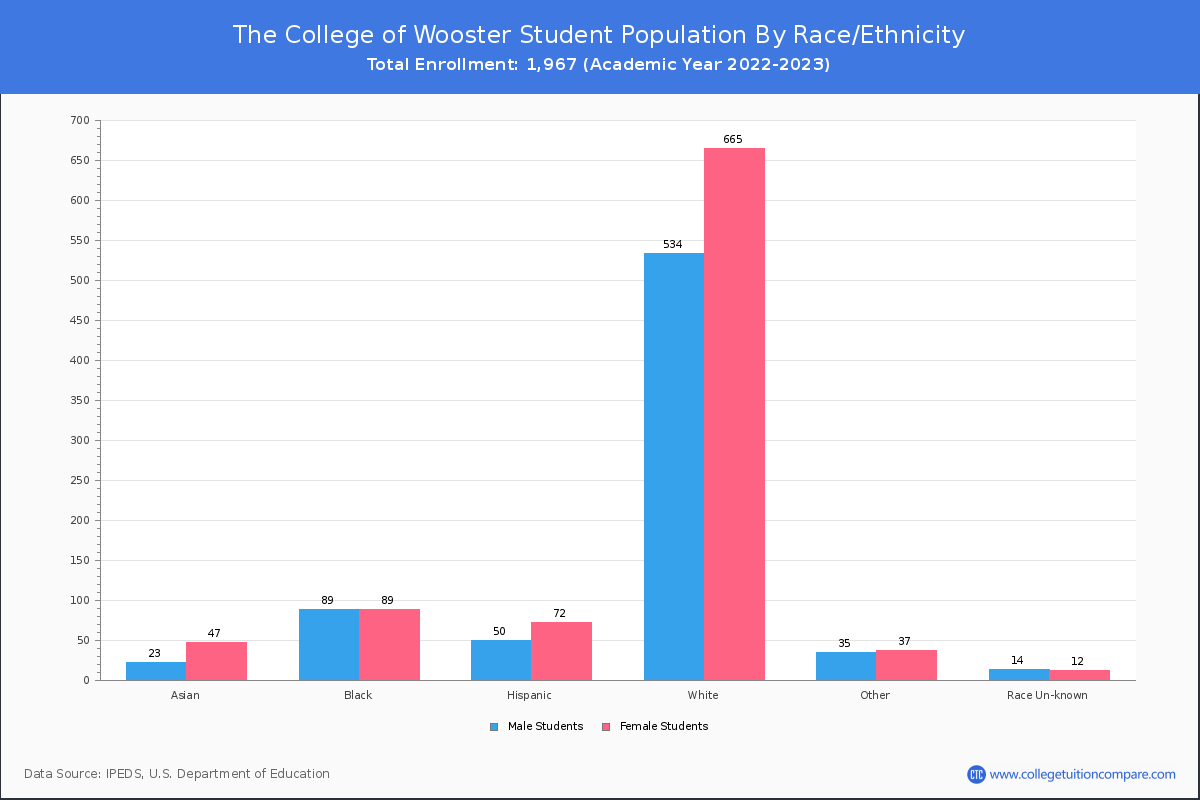
| Race | Total | Men | Women |
|---|---|---|---|
| American Indian or Native American | 3 | 3 | 0 |
| Asian | 79 | 24 | 55 |
| Black | 188 | 103 | 85 |
| Hispanic | 123 | 53 | 70 |
| Native Hawaiian or Other Pacific Islanders | 1 | 1 | 0 |
| White | 1,172 | 551 | 621 |
| Two or more races | 79 | 43 | 36 |
| Race Unknown | 27 | 16 | 11 |
Student Age Distribution
There are 1,959 students under 25 years old, and 8 students over 25 years old out of 1,967 total students.
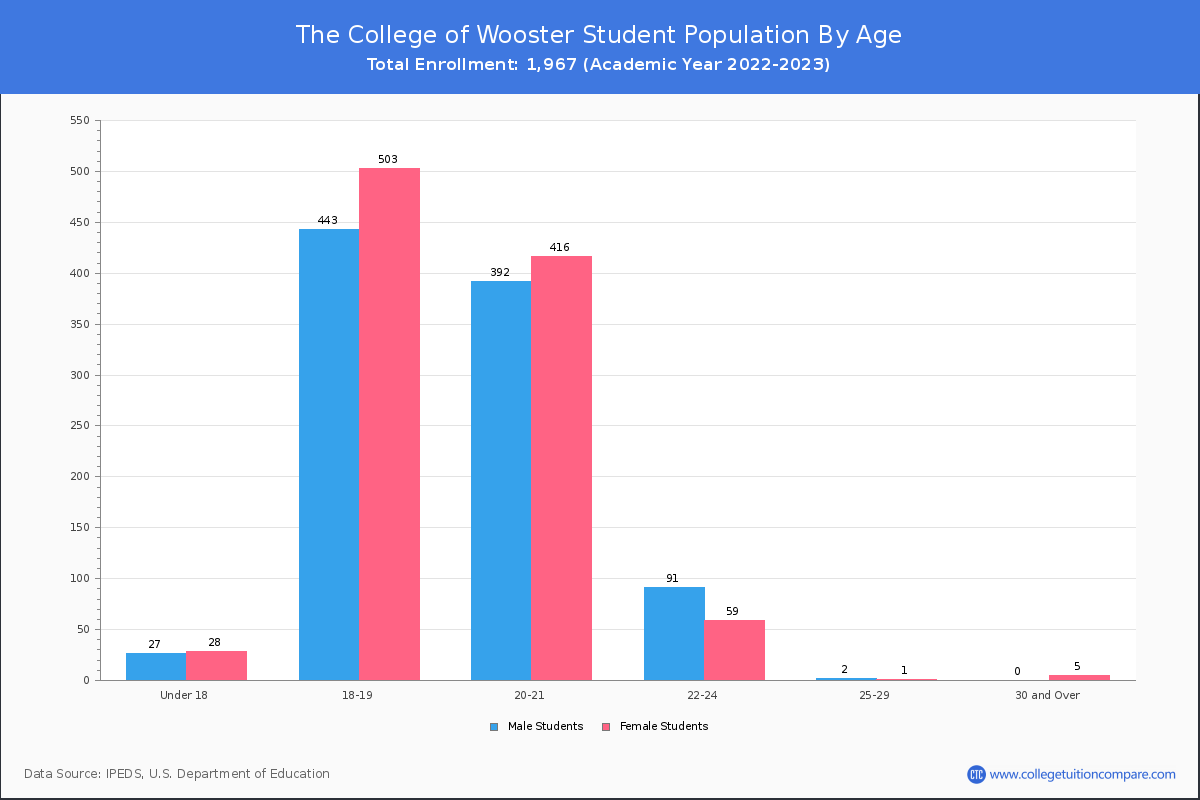
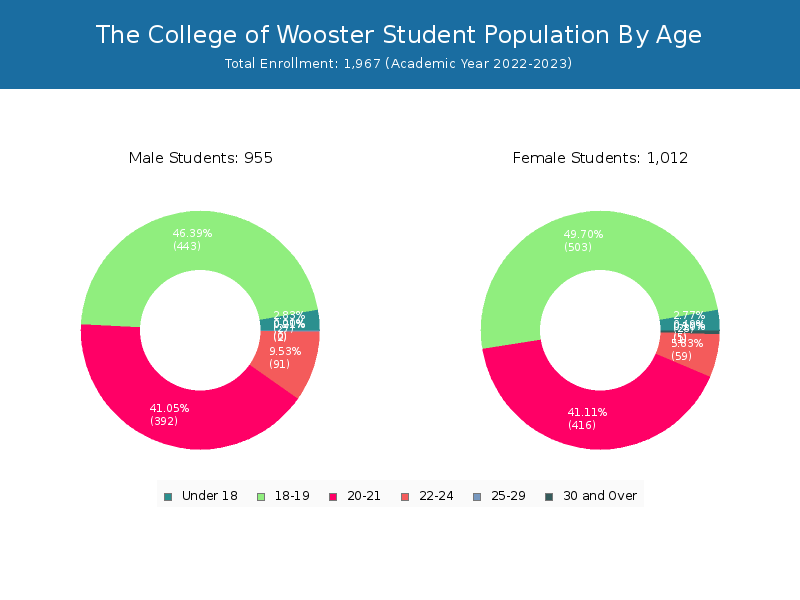
| Age | Total | Men | Women |
|---|---|---|---|
| Under 18 | 55 | 28 | 27 |
| 18-19 | 946 | 503 | 443 |
| 20-21 | 808 | 416 | 392 |
| 22-24 | 150 | 59 | 91 |
| 25-29 | 3 | 1 | 2 |
| 30-34 | 3 | 3 | 0 |
Transfer-in Students (Undergraduate)
Among 1,967 enrolled in undergraduate programs, 16 students have transferred-in from other institutions. The percentage of transfer-in students is 0.81%.
| Number of Students | |
|---|---|
| Regular Full-time | 1,942 |
| Transfer-in Full-time | 16 |