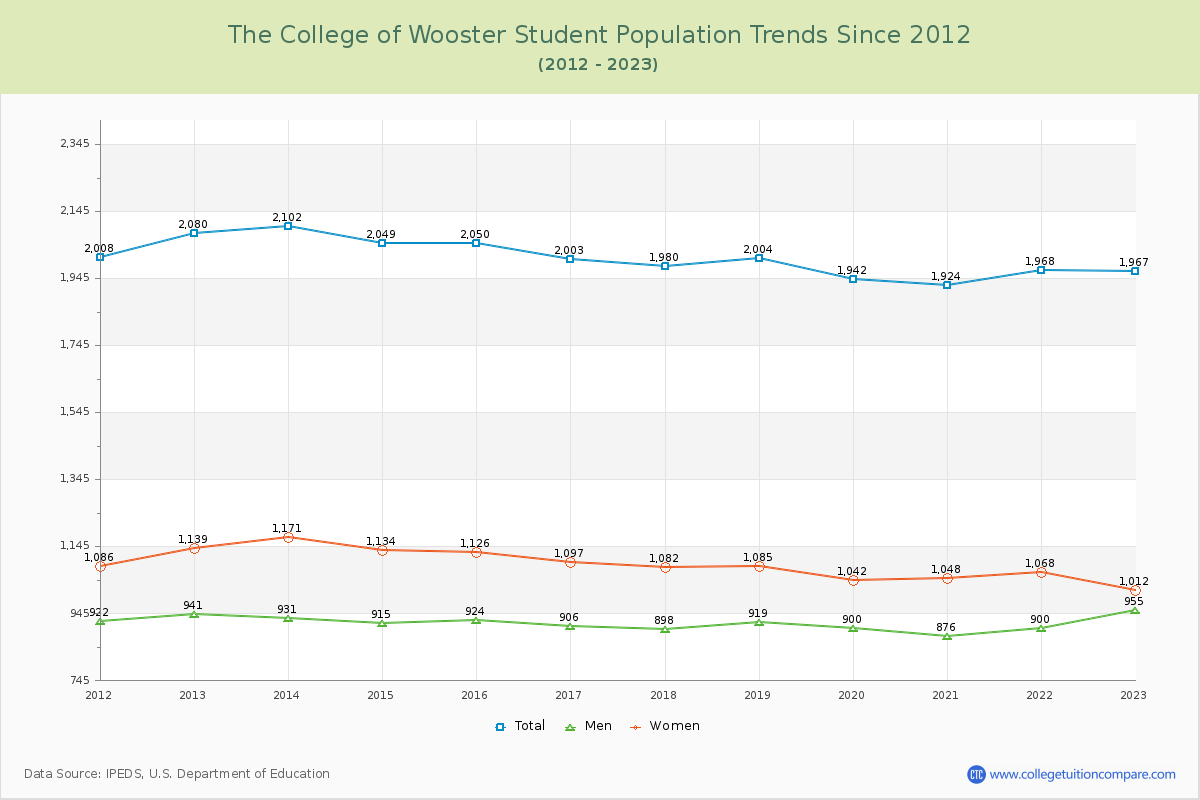
Student Population Changes
The average student population over the last 12 years is 2,006 where 1,967 students are attending the school for the academic year 2022-2023.
The female to male ratio is 1.06 to 1 and it means that there are similar numbers of female and male students enrolled in Wooster.
The following table and chart illustrate the changes in student population by gender at The College of Wooster since 2012.
| Year | Total | Men | Women |
|---|---|---|---|
| 2012-13 | 2,080 | 941 | 1,139 |
| 2013-14 | 2,102 22 | 931 -10 | 1,171 32 |
| 2014-15 | 2,049 -53 | 915 -16 | 1,134 -37 |
| 2015-16 | 2,050 1 | 924 9 | 1,126 -8 |
| 2016-17 | 2,003 -47 | 906 -18 | 1,097 -29 |
| 2017-18 | 1,980 -23 | 898 -8 | 1,082 -15 |
| 2018-19 | 2,004 24 | 919 21 | 1,085 3 |
| 2019-20 | 1,942 -62 | 900 -19 | 1,042 -43 |
| 2020-21 | 1,924 -18 | 876 -24 | 1,048 6 |
| 2021-22 | 1,968 44 | 900 24 | 1,068 20 |
| 2022-23 | 1,967 -1 | 955 55 | 1,012 -56 |
| Average | 2,006 | 915 | 1,091 |