Student Population by Gender
Warren Wilson College has a total of 793 enrolled students for the academic year 2022-2023. 723 students have enrolled in undergraduate programs and 70 students joined graduate programs.
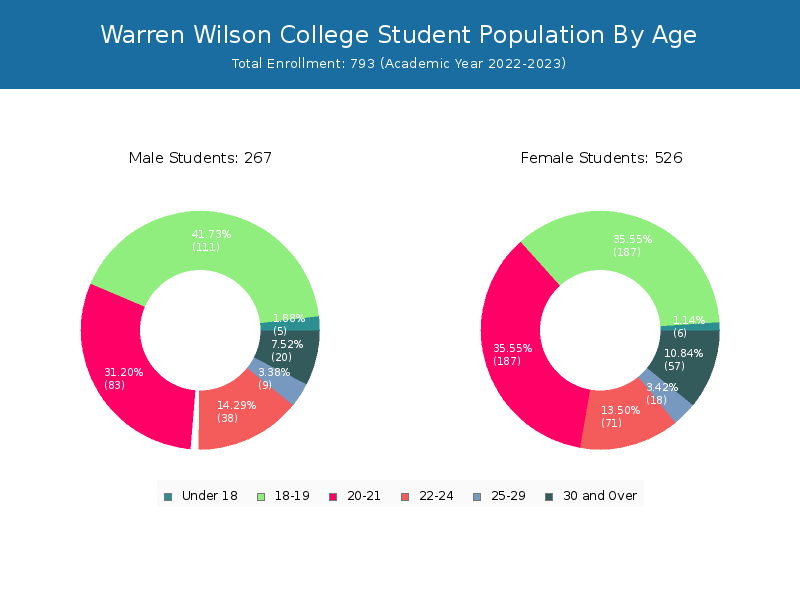
By gender, 267 male and 526 female students (the male-female ratio is 34:66) are attending the school. The gender distribution is based on the 2022-2023 data.
| Total | Undergraduate | Graduate | |
|---|---|---|---|
| Total | 793 | 723 | 70 |
| Men | 267 | 247 | 20 |
| Women | 526 | 476 | 50 |
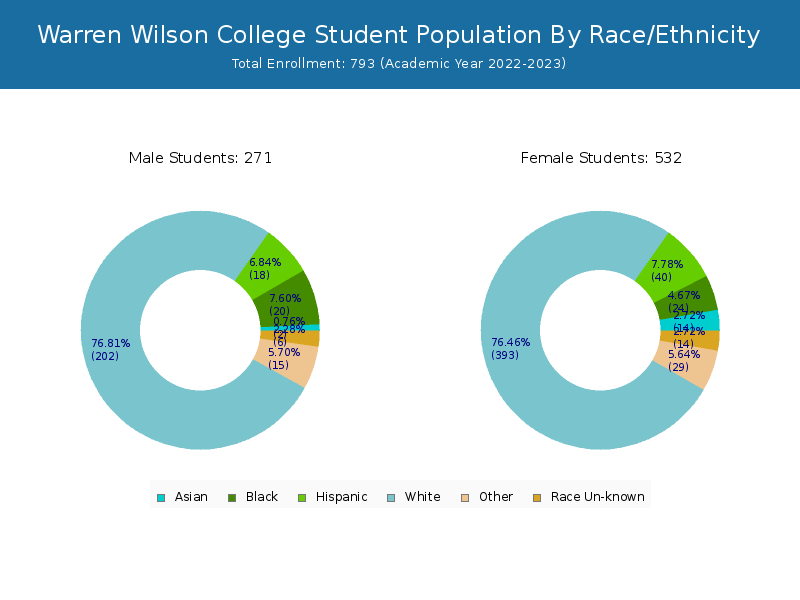
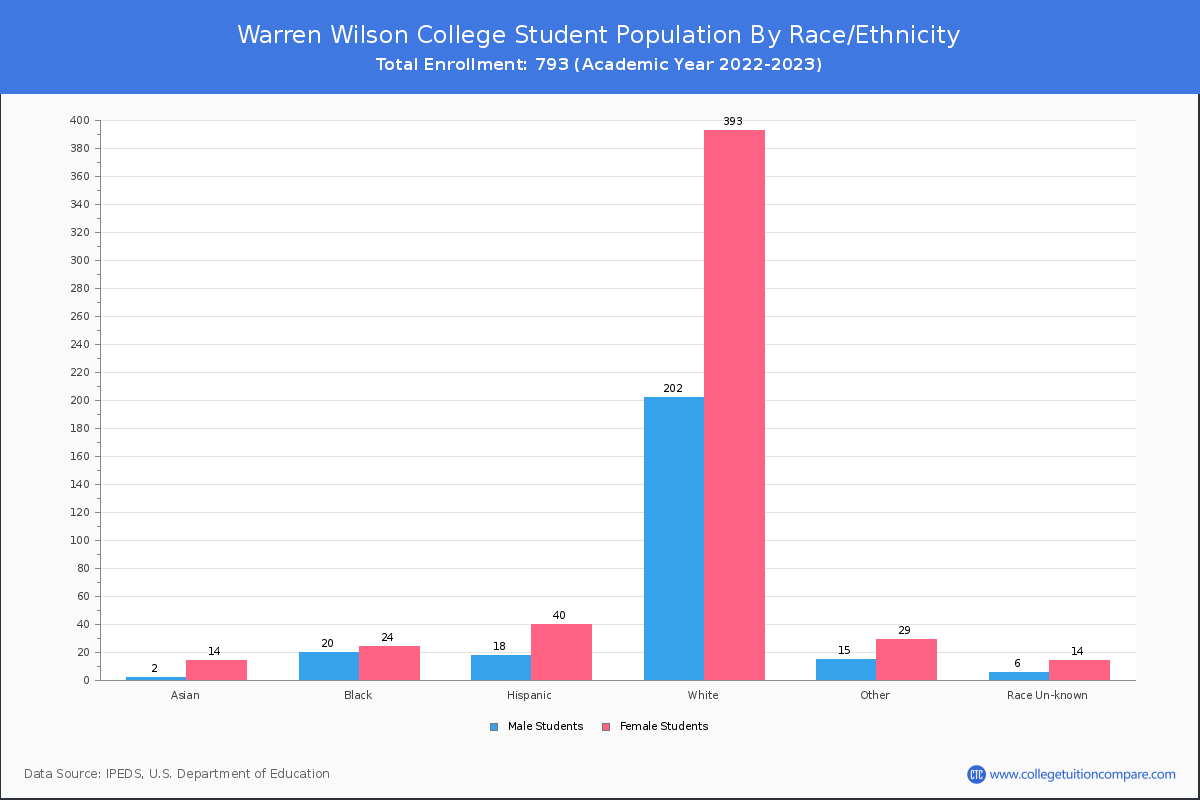
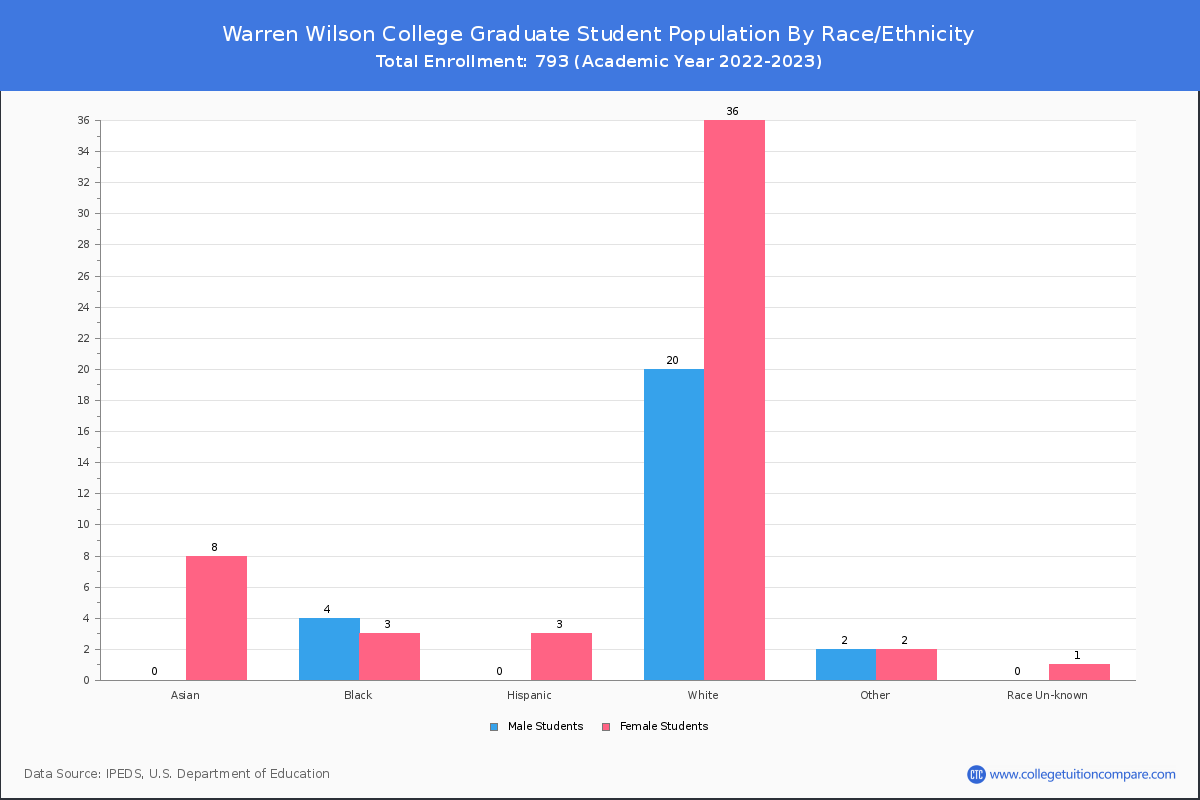
Student Distribution by Race/Ethnicity
By race/ethnicity, 590 White, 43 Black, and 12 Asian students out of a total of 793 are attending at Warren Wilson College. Comprehensive enrollment statistic data by race/ethnicity is shown in the next chart (Academic year 2022-2023 data).

| Race | Total | Men | Women |
|---|---|---|---|
| American Indian or Native American | 2 | 0 | 2 |
| Asian | 12 | 2 | 10 |
| Black | 43 | 24 | 19 |
| Hispanic | 58 | 20 | 38 |
| Native Hawaiian or Other Pacific Islanders | 1 | 1 | 0 |
| White | 590 | 191 | 399 |
| Two or more races | 30 | 12 | 18 |
| Race Unknown | 21 | 3 | 18 |
| Race | Total | Men | Women |
|---|---|---|---|
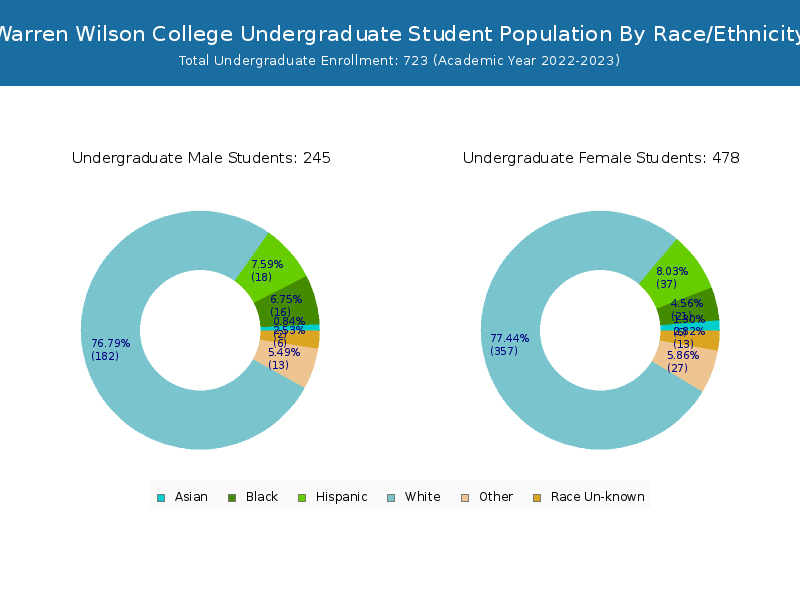
| American Indian or Native American | 2 | 0 | 2 |
| Asian | 7 | 2 | 5 |
| Black | 38 | 21 | 17 |
| Hispanic | 55 | 20 | 35 |
| Native Hawaiian or Other Pacific Islanders | 1 | 1 | 0 |
| White | 540 | 174 | 366 |
| Two or more races | 29 | 12 | 17 |
| Race Unknown | 17 | 3 | 14 |
| Race | Total | Men | Women |
|---|---|---|---|
| American Indian or Native American | 0 | 0 | 0 |
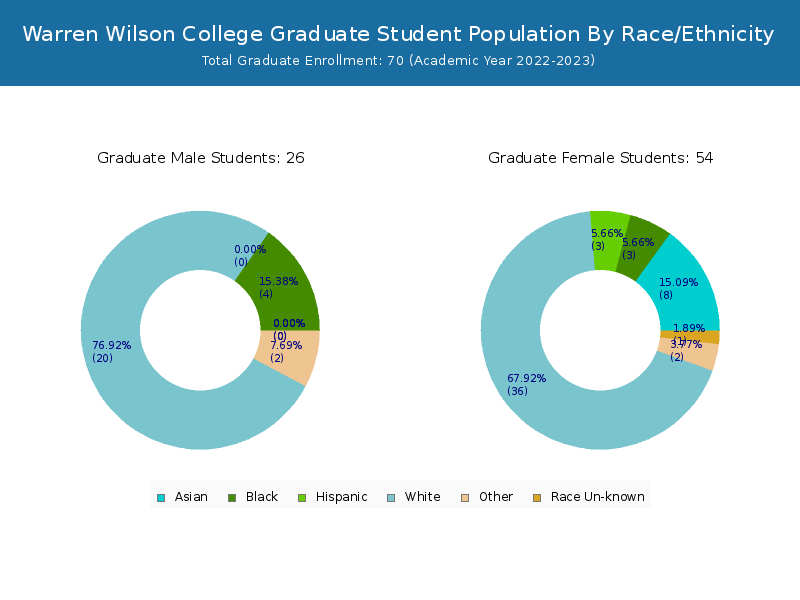
| Asian | 2 | 1 | 1 |
| Black | 0 | 0 | 0 |
| Hispanic | 3 | 1 | 2 |
| Native Hawaiian or Other Pacific Islanders | 0 | 0 | 0 |
| White | 29 | 5 | 24 |
| Two or more races | 2 | 1 | 1 |
| Race Unknown | 1 | 1 | 0 |
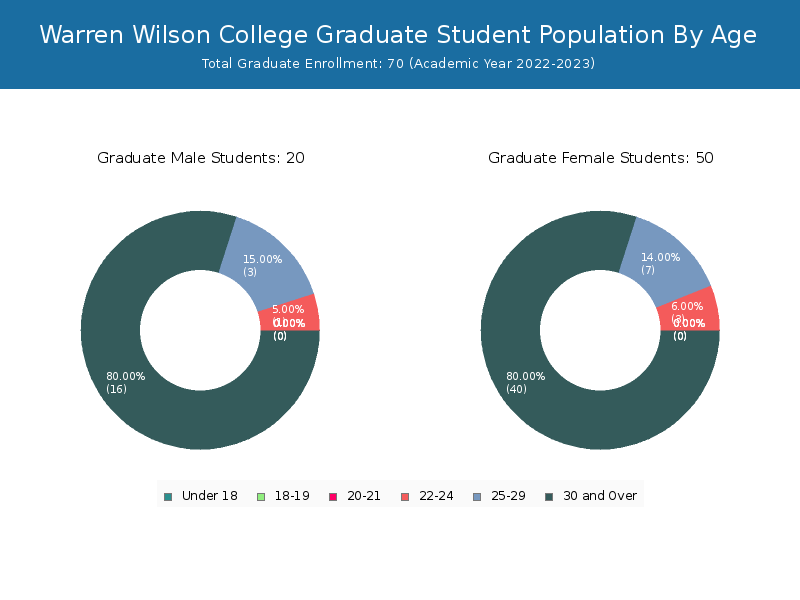
Student Age Distribution
By age, WWC has 11 students under 18 years old and 1 students over 65 years old. There are 688 students under 25 years old, and 104 students over 25 years old out of 793 total students.
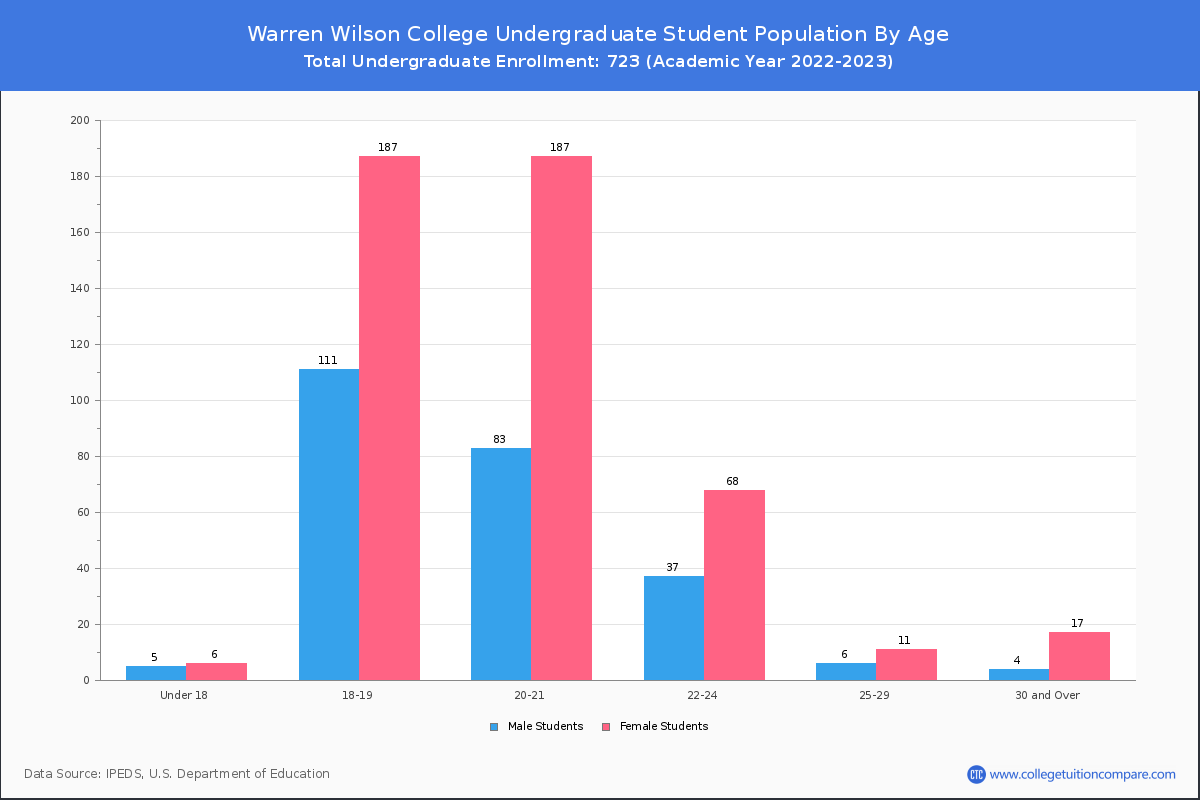
WWC has 684 undergraduate students aged under 25 and 38 students aged 25 and over.
It has 4 graduate students aged under 25 and 66 students aged 25 and over.
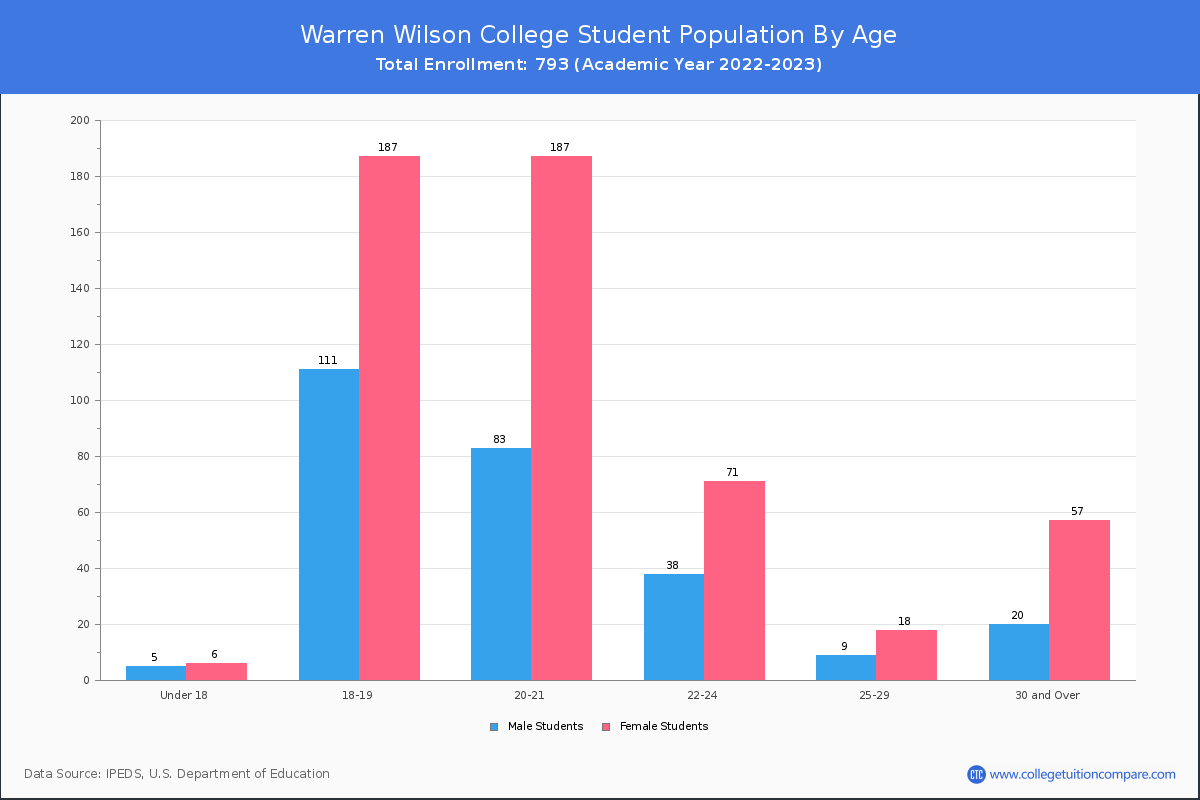
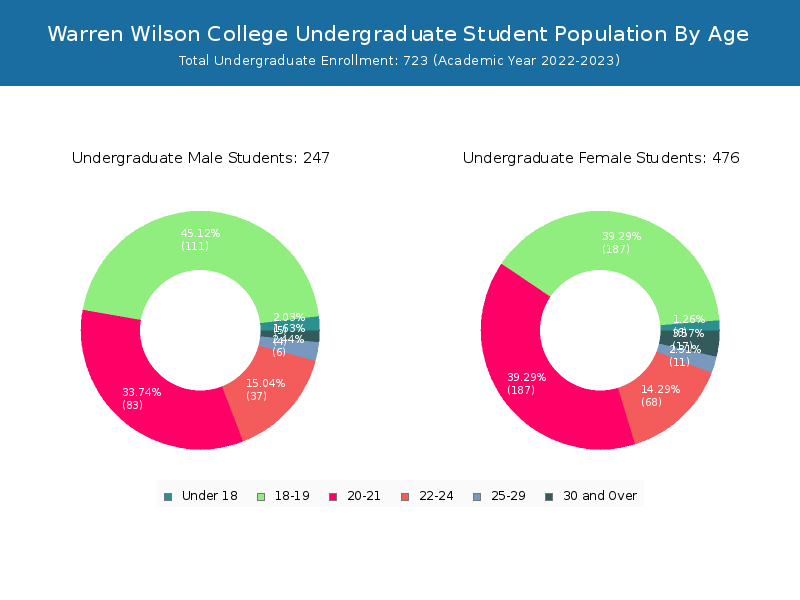

| Age | Total | Men | Women |
|---|---|---|---|
| Under 18 | 11 | 6 | 5 |
| 18-19 | 298 | 187 | 111 |
| 20-21 | 270 | 187 | 83 |
| 22-24 | 109 | 71 | 38 |
| 25-29 | 27 | 18 | 9 |
| 30-34 | 30 | 19 | 11 |
| 35-39 | 20 | 13 | 7 |
| 40-49 | 11 | 11 | 0 |
| 50-64 | 15 | 14 | 1 |
| Over 65 | 1 | 0 | 1 |
| Age | Total | Men | Women |
|---|---|---|---|
| Under 18 | 11 | 6 | 5 |
| 18-19 | 298 | 187 | 111 |
| 20-21 | 270 | 187 | 83 |
| 22-24 | 105 | 68 | 37 |
| 25-29 | 17 | 11 | 6 |
| 30-34 | 12 | 9 | 3 |
| 35-39 | 3 | 2 | 1 |
| 40-49 | 1 | 1 | 0 |
| 50-64 | 5 | 5 | 0 |
| Age | Total | Men | Women |
|---|
Online Student Enrollment
Distance learning, also called online education, is very attractive to students, especially who want to continue education and work in field. At Warren Wilson College, 104 students are enrolled in some online courses.
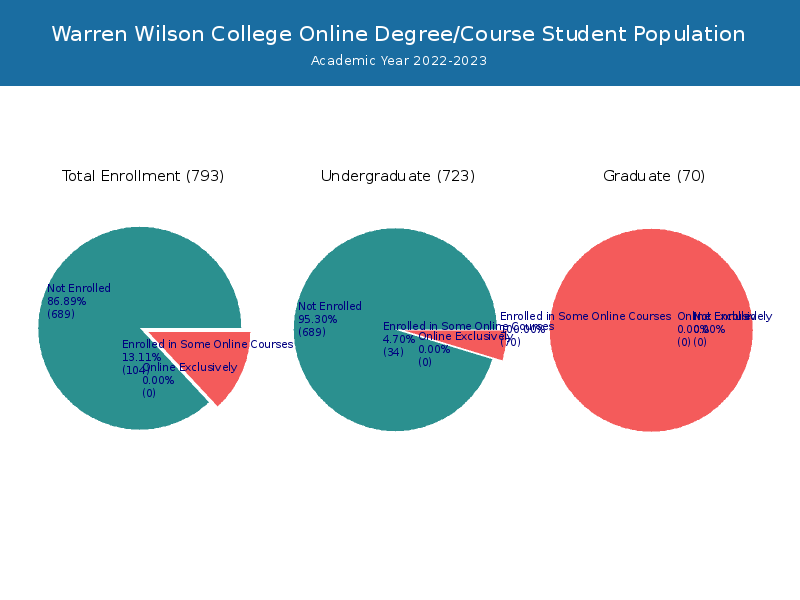
| All Students | Enrolled Exclusively Online Courses | Enrolled in Some Online Courses | |
|---|---|---|---|
| All Students | 793 | 0 | 104 |
| Undergraduate | 723 | 0 | 34 |
| Graduate | 70 | 0 | 70 |
| North Carolina Residents | Other States in U.S. | Outside of U.S. | |
|---|---|---|---|
| All Students | 0 | - | 0 |
| Undergraduate | 0 | - | 0 |
| Graduate | 0 | - | 0 |
Transfer-in Students (Undergraduate)
Among 723 enrolled in undergraduate programs, 39 students have transferred-in from other institutions. The percentage of transfer-in students is 5.39%.
| Number of Students | |
|---|---|
| Regular Full-time | 671 |
| Transfer-in Full-time | 39 |