Student Population by Gender
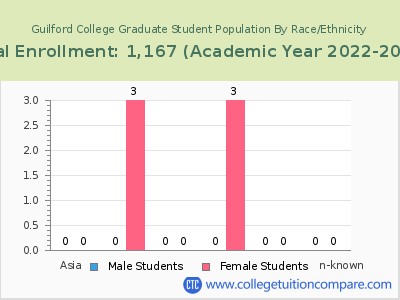
Guilford College has a total of 1,167 enrolled students for the academic year 2022-2023. 1,129 students have enrolled in undergraduate programs and 38 students joined graduate programs.
By gender, 577 male and 590 female students (the male-female ratio is 49:51) are attending the school. The gender distribution is based on the 2022-2023 data.
| Total | Undergraduate | Graduate | |
|---|---|---|---|
| Total | 1,167 | 1,129 | 38 |
| Men | 577 | 562 | 15 |
| Women | 590 | 567 | 23 |
Student Distribution by Race/Ethnicity
| Race | Total | Men | Women |
|---|---|---|---|
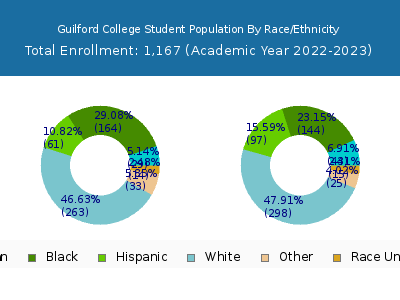
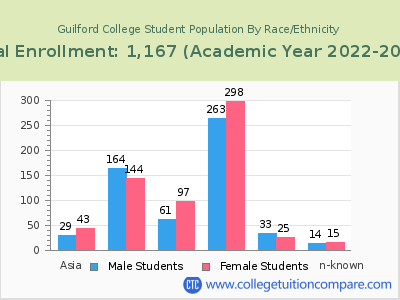
| American Indian or Native American | 3 | 0 | 3 |
| Asian | 74 | 37 | 37 |
| Black | 330 | 181 | 149 |
| Hispanic | 171 | 72 | 99 |
| Native Hawaiian or Other Pacific Islanders | 0 | 0 | 0 |
| White | 495 | 243 | 252 |
| Two or more races | 57 | 29 | 28 |
| Race Unknown | 24 | 9 | 15 |
| Race | Total | Men | Women |
|---|---|---|---|
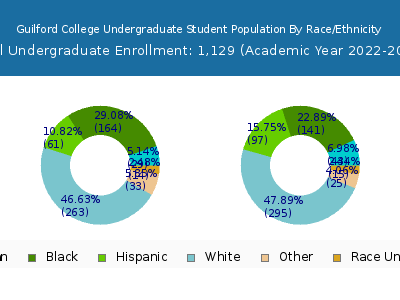
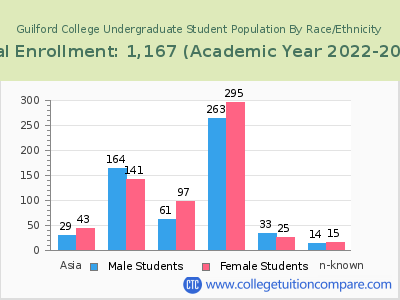
| American Indian or Native American | 3 | 0 | 3 |
| Asian | 74 | 37 | 37 |
| Black | 318 | 175 | 143 |
| Hispanic | 169 | 72 | 97 |
| Native Hawaiian or Other Pacific Islanders | 0 | 0 | 0 |
| White | 474 | 235 | 239 |
| Two or more races | 54 | 28 | 26 |
| Race Unknown | 24 | 9 | 15 |
| Race | Total | Men | Women |
|---|---|---|---|
| American Indian or Native American | 0 | 0 | 0 |
| Asian | 0 | 0 | 0 |
| Black | 9 | 2 | 7 |
| Hispanic | 8 | 5 | 3 |
| Native Hawaiian or Other Pacific Islanders | 0 | 0 | 0 |
| White | 24 | 17 | 7 |
| Two or more races | 2 | 1 | 1 |
| Race Unknown | 0 | 0 | 0 |
Online Student Enrollment
| All Students | Enrolled Exclusively Online Courses | Enrolled in Some Online Courses | |
|---|---|---|---|
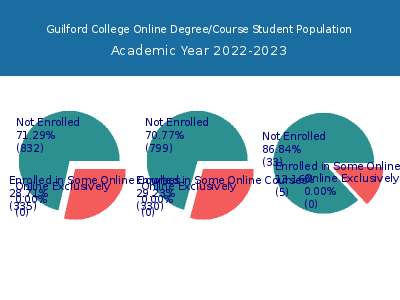
| All Students | 1,167 | 0 | 335 |
| Undergraduate | 1,129 | 0 | 330 |
| Graduate | 38 | 0 | 5 |
| North Carolina Residents | Other States in U.S. | Outside of U.S. | |
|---|---|---|---|
| All Students | 0 | - | 0 |
| Undergraduate | 0 | - | 0 |
| Graduate | 0 | - | 0 |
Transfer-in Students (Undergraduate)
Among 1,129 enrolled in undergraduate programs, 43 students have transferred-in from other institutions. The percentage of transfer-in students is 3.81%.
| Number of Students | |
|---|---|
| Regular Full-time | 1,054 |
| Transfer-in Full-time | 43 |
