Student Population by Gender
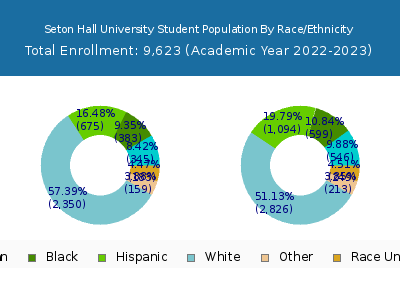
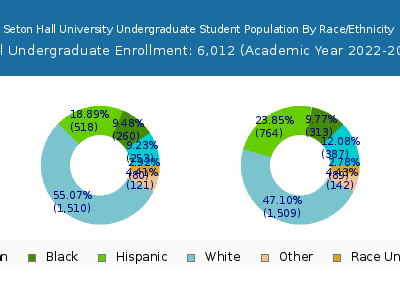
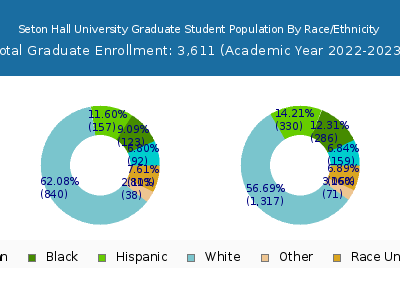
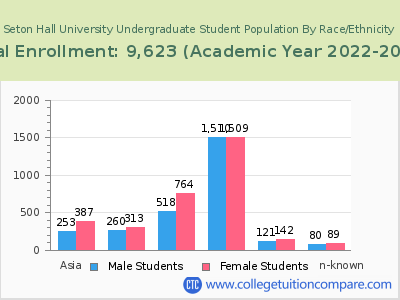
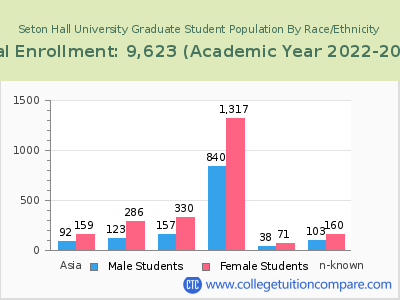
Seton Hall University has a total of 9,623 enrolled students for the academic year 2022-2023. 6,012 students have enrolled in undergraduate programs and 3,611 students joined graduate programs.
By gender, 4,040 male and 5,583 female students (the male-female ratio is 42:58) are attending the school. The gender distribution is based on the 2022-2023 data.
| Total | Undergraduate | Graduate | |
|---|---|---|---|
| Total | 9,623 | 6,012 | 3,611 |
| Men | 4,040 | 2,707 | 1,333 |
| Women | 5,583 | 3,305 | 2,278 |
Student Distribution by Race/Ethnicity
| Race | Total | Men | Women |
|---|---|---|---|
| American Indian or Native American | 11 | 6 | 5 |
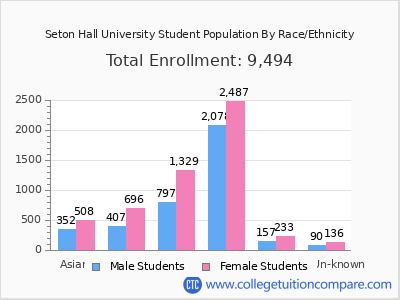
| Asian | 921 | 354 | 567 |
| Black | 1,048 | 400 | 648 |
| Hispanic | 1,908 | 691 | 1,217 |
| Native Hawaiian or Other Pacific Islanders | 11 | 5 | 6 |
| White | 4,909 | 2,225 | 2,684 |
| Two or more races | 335 | 133 | 202 |
| Race Unknown | 283 | 128 | 155 |
| Race | Total | Men | Women |
|---|---|---|---|
| American Indian or Native American | 9 | 6 | 3 |
| Asian | 654 | 258 | 396 |
| Black | 643 | 282 | 361 |
| Hispanic | 1,413 | 534 | 879 |
| Native Hawaiian or Other Pacific Islanders | 4 | 4 | 0 |
| White | 2,824 | 1,418 | 1,406 |
| Two or more races | 232 | 99 | 133 |
| Race Unknown | 154 | 68 | 86 |
| Race | Total | Men | Women |
|---|---|---|---|
| American Indian or Native American | 0 | 0 | 0 |
| Asian | 13 | 8 | 5 |
| Black | 36 | 13 | 23 |
| Hispanic | 42 | 15 | 27 |
| Native Hawaiian or Other Pacific Islanders | 0 | 0 | 0 |
| White | 67 | 32 | 35 |
| Two or more races | 7 | 2 | 5 |
| Race Unknown | 14 | 4 | 10 |
Student Age Distribution
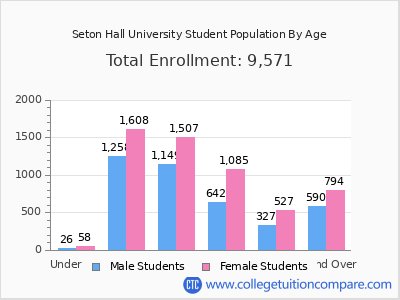
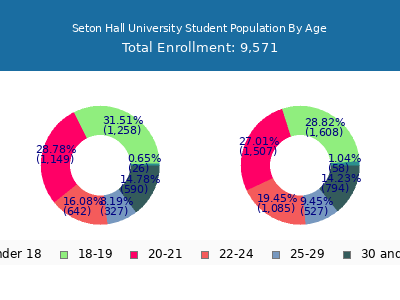
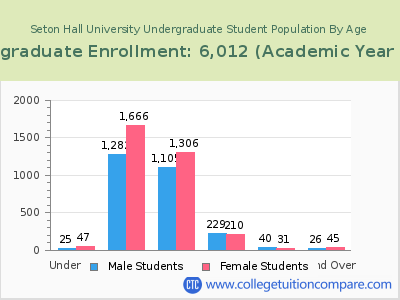
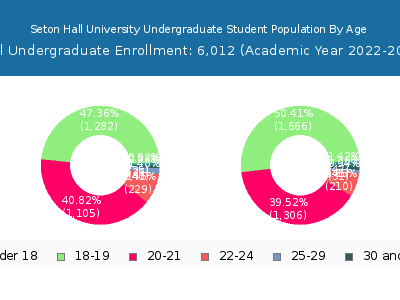
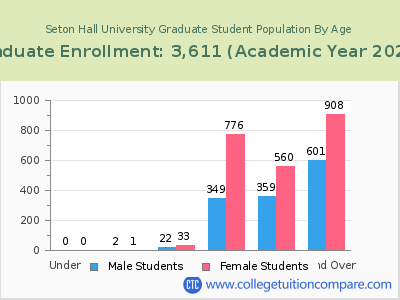
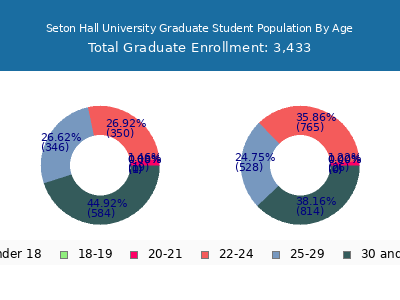
By age, Seton Hall has 72 students under 18 years old and 46 students over 65 years old. There are 7,053 students under 25 years old, and 2,570 students over 25 years old out of 9,623 total students.
In undergraduate programs, 72 students are younger than 18 and 15 students are older than 65. Seton Hall has 5,870 undergraduate students aged under 25 and 142 students aged 25 and over.
It has 1,183 graduate students aged under 25 and 2,428 students aged 25 and over.
| Age | Total | Men | Women |
|---|---|---|---|
| Under 18 | 72 | 47 | 25 |
| 18-19 | 2,951 | 1,667 | 1,284 |
| 20-21 | 2,466 | 1,339 | 1,127 |
| 22-24 | 1,564 | 986 | 578 |
| 25-29 | 990 | 591 | 399 |
| 30-34 | 474 | 274 | 200 |
| 35-39 | 279 | 172 | 107 |
| 40-49 | 429 | 284 | 145 |
| 50-64 | 352 | 199 | 153 |
| Over 65 | 46 | 24 | 22 |
| Age | Total | Men | Women |
|---|---|---|---|
| Under 18 | 72 | 47 | 25 |
| 18-19 | 2,948 | 1,666 | 1,282 |
| 20-21 | 2,411 | 1,306 | 1,105 |
| 22-24 | 439 | 210 | 229 |
| 25-29 | 71 | 31 | 40 |
| 30-34 | 27 | 17 | 10 |
| 35-39 | 11 | 7 | 4 |
| 40-49 | 13 | 10 | 3 |
| 50-64 | 5 | 4 | 1 |
| Over 65 | 15 | 7 | 8 |
| Age | Total | Men | Women |
|---|
Online Student Enrollment
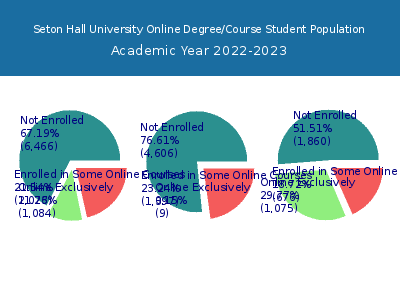
Distance learning, also called online education, is very attractive to students, especially who want to continue education and work in field. At Seton Hall University, 1,084 students are enrolled exclusively in online courses and 2,073 students are enrolled in some online courses.
725 students lived in New Jersey or jurisdiction in which the school is located are enrolled exclusively in online courses and 359 students live in other State or outside of the United States.
| All Students | Enrolled Exclusively Online Courses | Enrolled in Some Online Courses | |
|---|---|---|---|
| All Students | 9,623 | 1,084 | 2,073 |
| Undergraduate | 6,012 | 9 | 1,397 |
| Graduate | 3,611 | 1,075 | 676 |
| New Jersey Residents | Other States in U.S. | Outside of U.S. | |
|---|---|---|---|
| All Students | 725 | 339 | 20 |
| Undergraduate | 6 | 3 | 0 |
| Graduate | 719 | 336 | 20 |
Transfer-in Students (Undergraduate)
Among 6,012 enrolled in undergraduate programs, 180 students have transferred-in from other institutions. The percentage of transfer-in students is 2.99%.176 students have transferred in as full-time status and 4 students transferred in as part-time status.
| Number of Students | |
|---|---|
| Regular Full-time | 5,668 |
| Transfer-in Full-time | 176 |
| Regular Part-time | 164 |
| Transfer-in Part-time | 4 |
