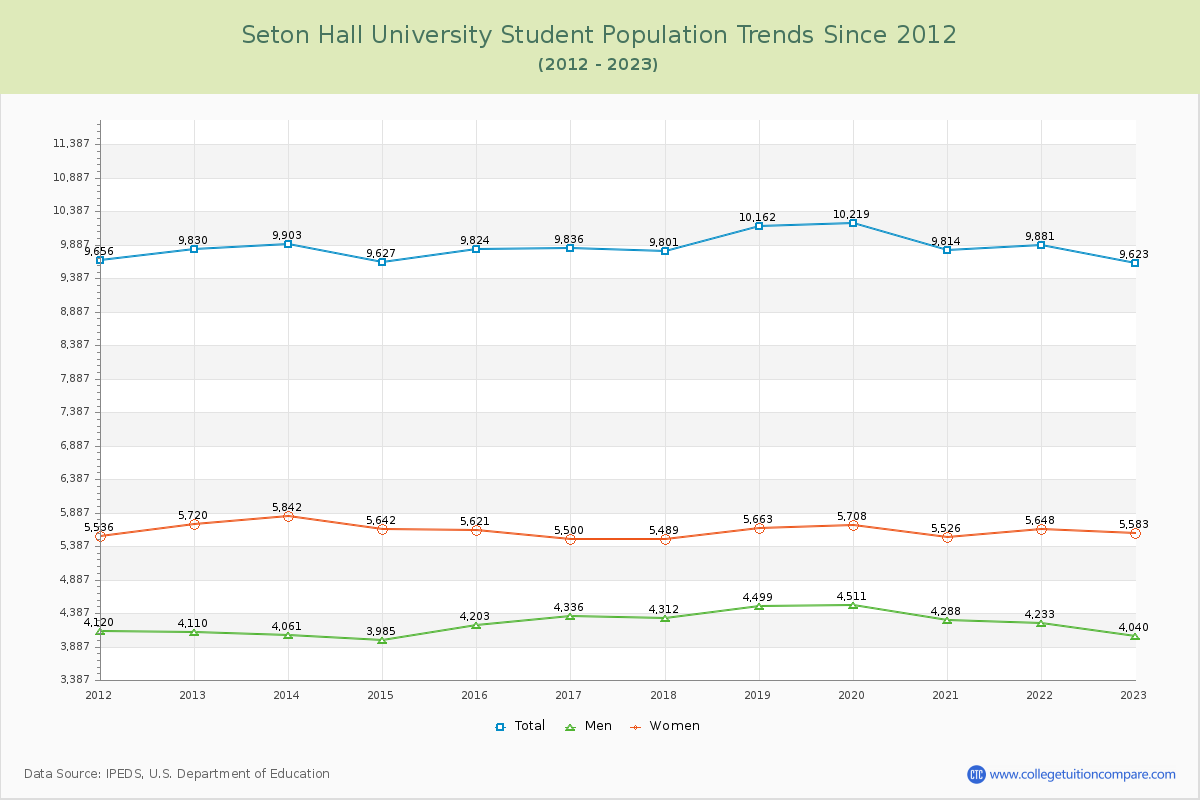
Student Population Changes
The average student population over the last 12 years is 9,865 where 9,623 students are attending the school for the academic year 2022-2023.
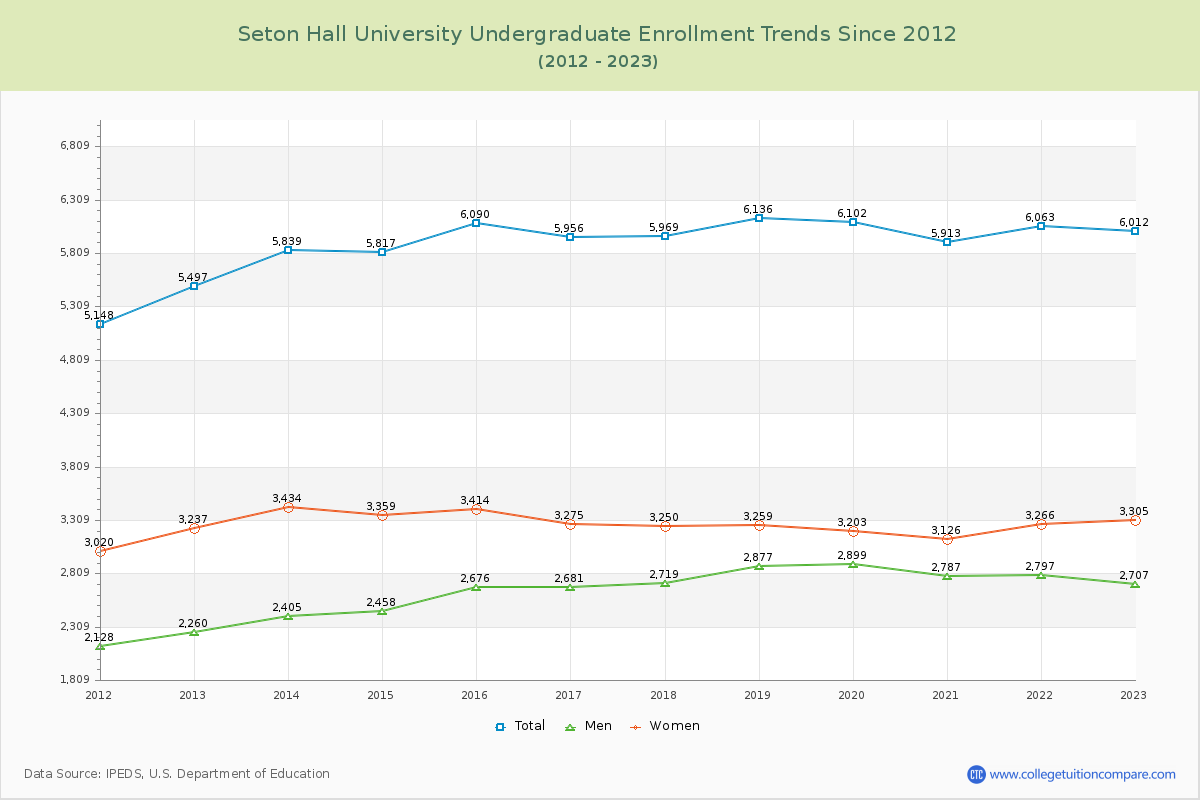
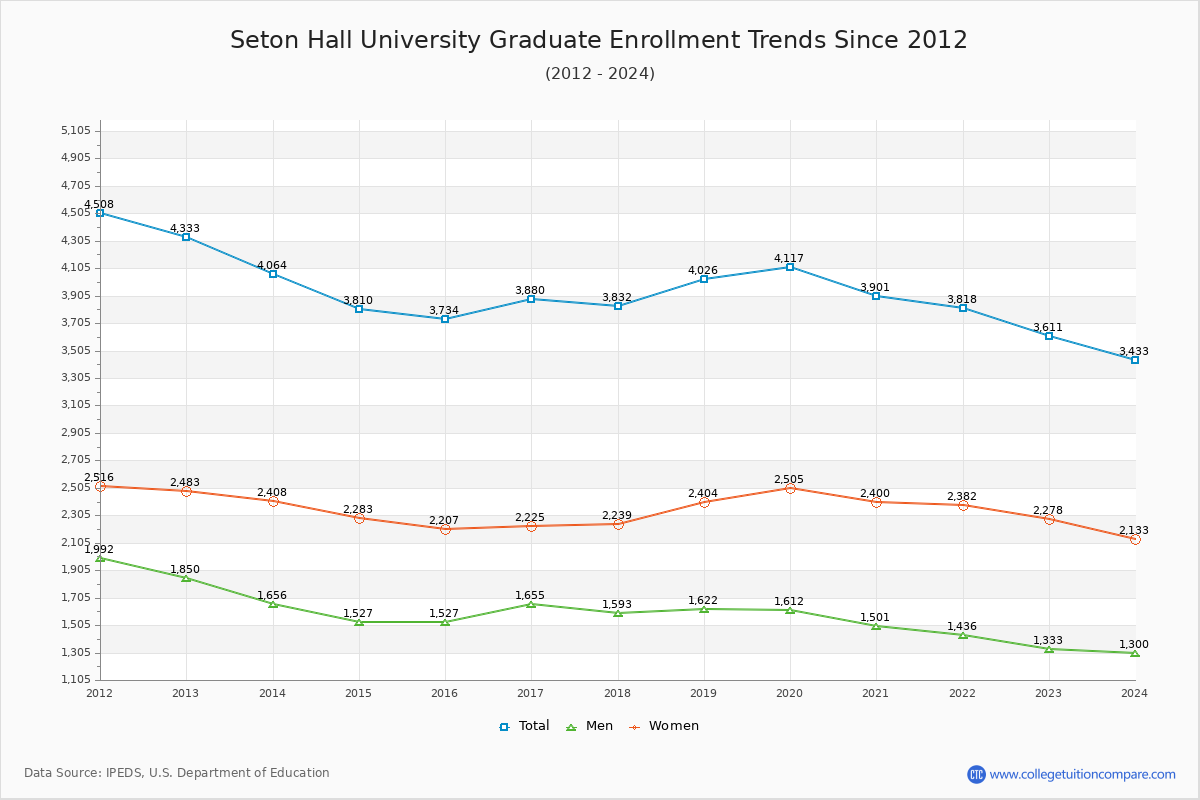
62.48% of total students is undergraduate students and 37.52% students is graduate students. The number of undergraduate students has increased by 515 and the graduate enrollment has decreased by 722 over past 10 years.
The female to male ratio is 1.38 to 1 and it means that there are more female students enrolled in Seton Hall than male students.
The following table and chart illustrate the changes in student population by gender at Seton Hall University since 2012.
| Year | Total | Undergraduate | Graduate | ||||
|---|---|---|---|---|---|---|---|
| Total | Men | Women | Total | Men | Women | ||
| 2012-13 | 9,830 | 5,497 | 2,260 | 3,237 | 4,333 | 1,850 | 2,483 |
| 2013-14 | 9,903 73 | 5,839 342 | 2,405 145 | 3,434 197 | 4,064 -269 | 1,656 -194 | 2,408 -75 |
| 2014-15 | 9,627 -276 | 5,817 -22 | 2,458 53 | 3,359 -75 | 3,810 -254 | 1,527 -129 | 2,283 -125 |
| 2015-16 | 9,824 197 | 6,090 273 | 2,676 218 | 3,414 55 | 3,734 -76 | 1,527 0 | 2,207 -76 |
| 2016-17 | 9,836 12 | 5,956 -134 | 2,681 5 | 3,275 -139 | 3,880 146 | 1,655 128 | 2,225 18 |
| 2017-18 | 9,801 -35 | 5,969 13 | 2,719 38 | 3,250 -25 | 3,832 -48 | 1,593 -62 | 2,239 14 |
| 2018-19 | 10,162 361 | 6,136 167 | 2,877 158 | 3,259 9 | 4,026 194 | 1,622 29 | 2,404 165 |
| 2019-20 | 10,219 57 | 6,102 -34 | 2,899 22 | 3,203 -56 | 4,117 91 | 1,612 -10 | 2,505 101 |
| 2020-21 | 9,814 -405 | 5,913 -189 | 2,787 -112 | 3,126 -77 | 3,901 -216 | 1,501 -111 | 2,400 -105 |
| 2021-22 | 9,881 67 | 6,063 150 | 2,797 10 | 3,266 140 | 3,818 -83 | 1,436 -65 | 2,382 -18 |
| 2022-23 | 9,623 -258 | 6,012 -51 | 2,707 -90 | 3,305 39 | 3,611 -207 | 1,333 -103 | 2,278 -104 |
| Average | 9,865 | 5,945 | 2,661 | 3,284 | 3,921 | 1,574 | 2,347 |