Student Population by Gender
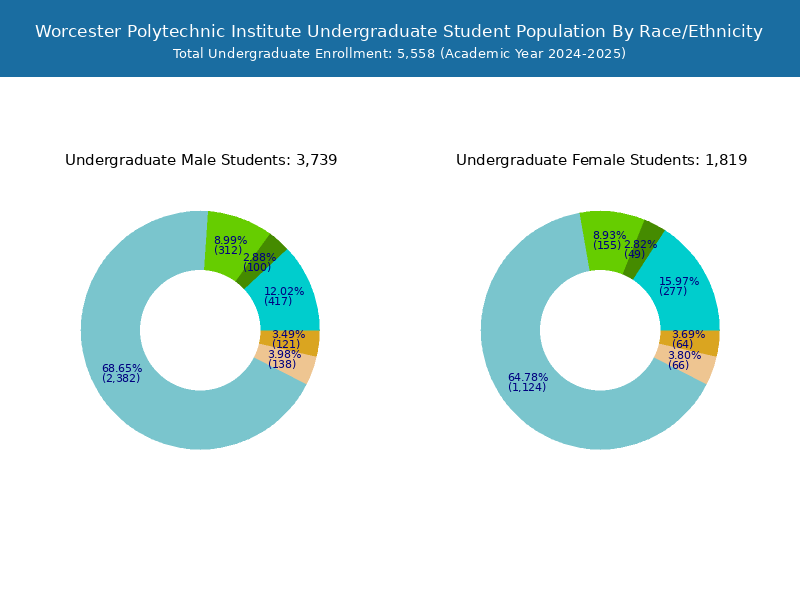
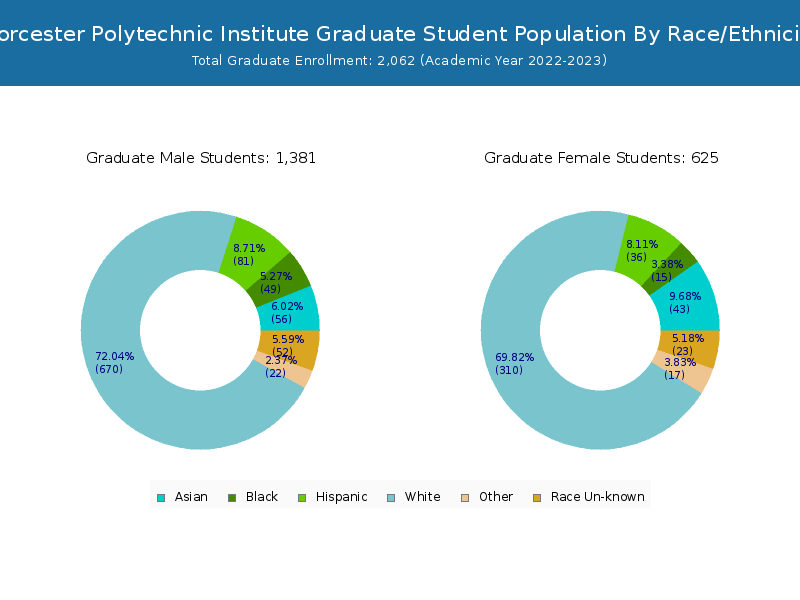
Worcester Polytechnic Institute has a total of 7,308 enrolled students for the academic year 2022-2023. 5,246 students have enrolled in undergraduate programs and 2,062 students joined graduate programs.
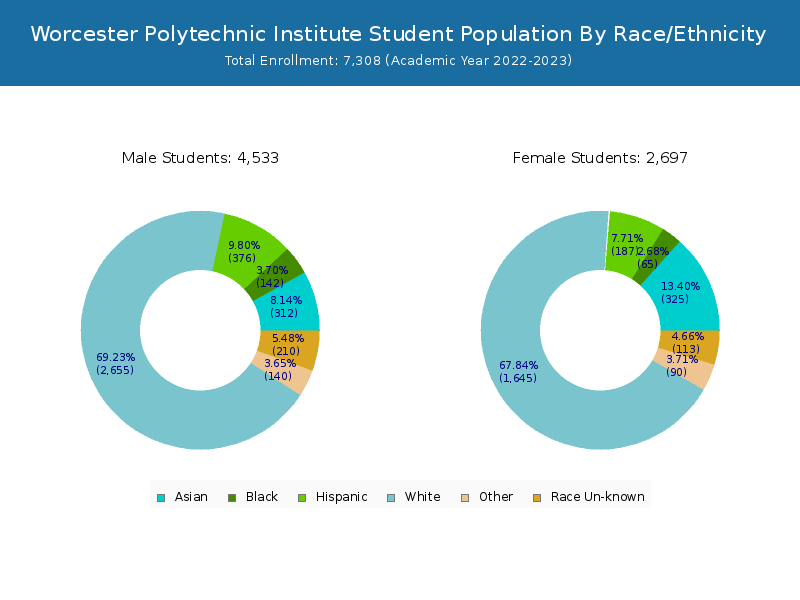
By gender, 4,703 male and 2,605 female students (the male-female ratio is 64:36) are attending the school. The gender distribution is based on the 2022-2023 data.
| Total | Undergraduate | Graduate | |
|---|---|---|---|
| Total | 7,308 | 5,246 | 2,062 |
| Men | 4,703 | 3,303 | 1,400 |
| Women | 2,605 | 1,943 | 662 |
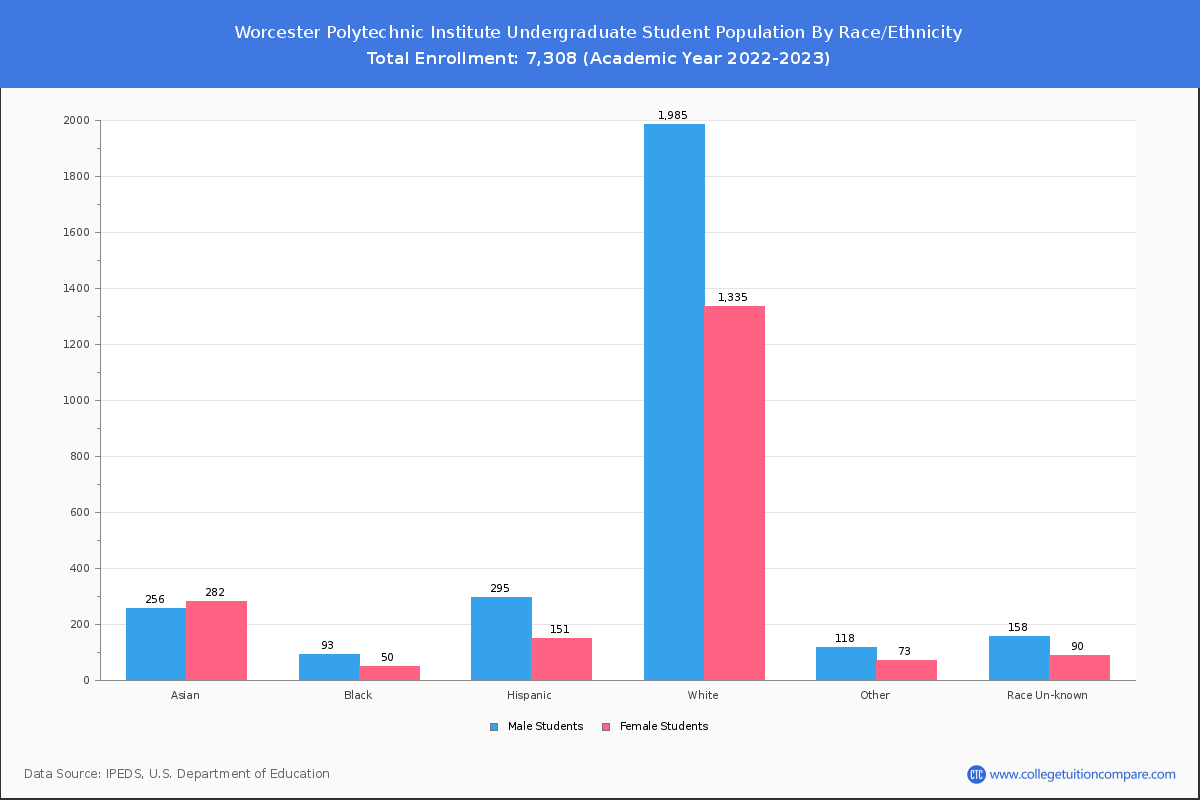
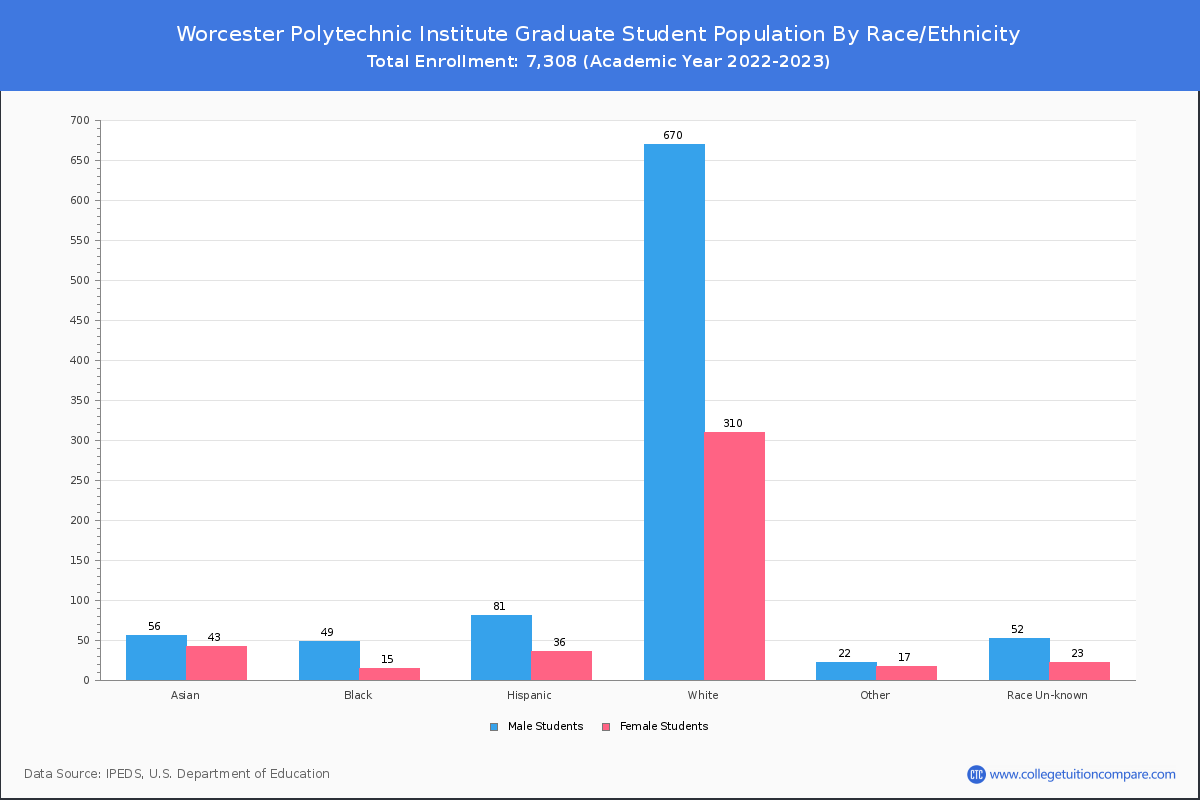
Student Distribution by Race/Ethnicity
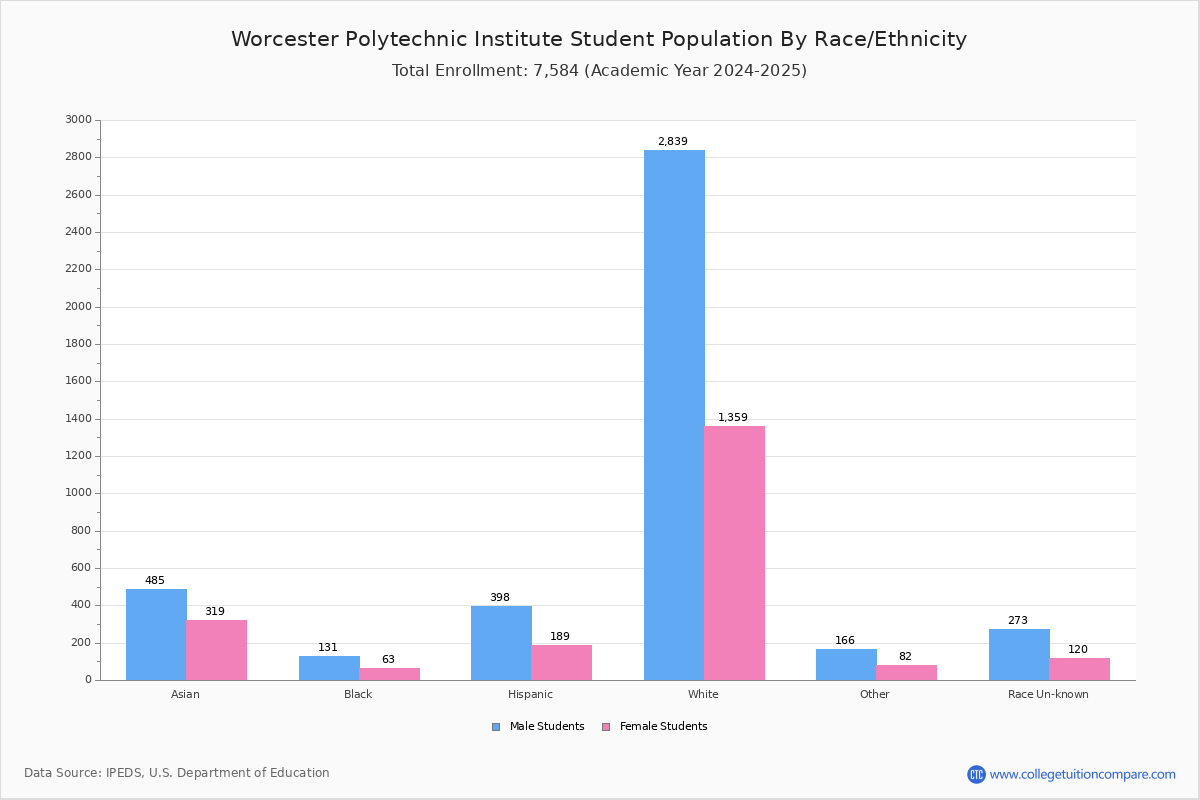
By race/ethnicity, 4,233 White, 217 Black, and 739 Asian students out of a total of 7,308 are attending at Worcester Polytechnic Institute. Comprehensive enrollment statistic data by race/ethnicity is shown in the next chart (Academic year 2022-2023 data).
| Race | Total | Men | Women |
|---|---|---|---|
| American Indian or Native American | 2 | 2 | 0 |
| Asian | 739 | 404 | 335 |
| Black | 217 | 149 | 68 |
| Hispanic | 567 | 381 | 186 |
| Native Hawaiian or Other Pacific Islanders | 2 | 1 | 1 |
| White | 4,233 | 2,669 | 1,564 |
| Two or more races | 227 | 137 | 90 |
| Race Unknown | 221 | 154 | 67 |
| Race | Total | Men | Women |
|---|---|---|---|
| American Indian or Native American | 2 | 2 | 0 |
| Asian | 624 | 334 | 290 |
| Black | 143 | 94 | 49 |
| Hispanic | 452 | 303 | 149 |
| Native Hawaiian or Other Pacific Islanders | 2 | 1 | 1 |
| White | 3,337 | 2,078 | 1,259 |
| Two or more races | 190 | 116 | 74 |
| Race Unknown | 130 | 94 | 36 |
| Race | Total | Men | Women |
|---|---|---|---|
| American Indian or Native American | 0 | 0 | 0 |
| Asian | 7 | 4 | 3 |
| Black | 3 | 2 | 1 |
| Hispanic | 8 | 7 | 1 |
| Native Hawaiian or Other Pacific Islanders | 0 | 0 | 0 |
| White | 41 | 30 | 11 |
| Two or more races | 0 | 0 | 0 |
| Race Unknown | 1 | 0 | 1 |
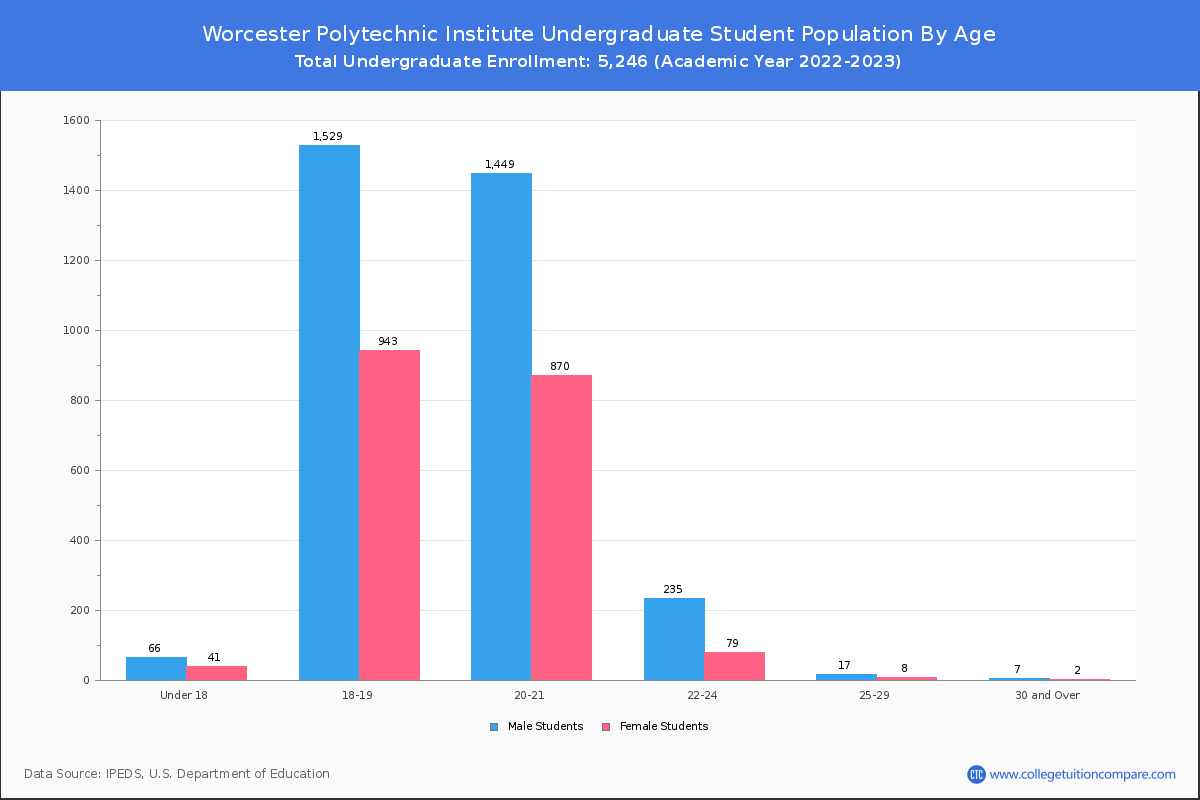
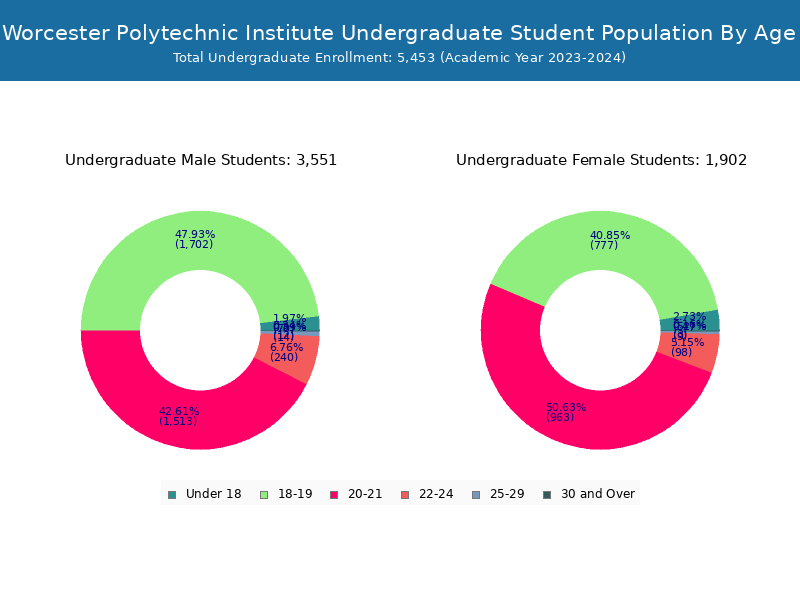
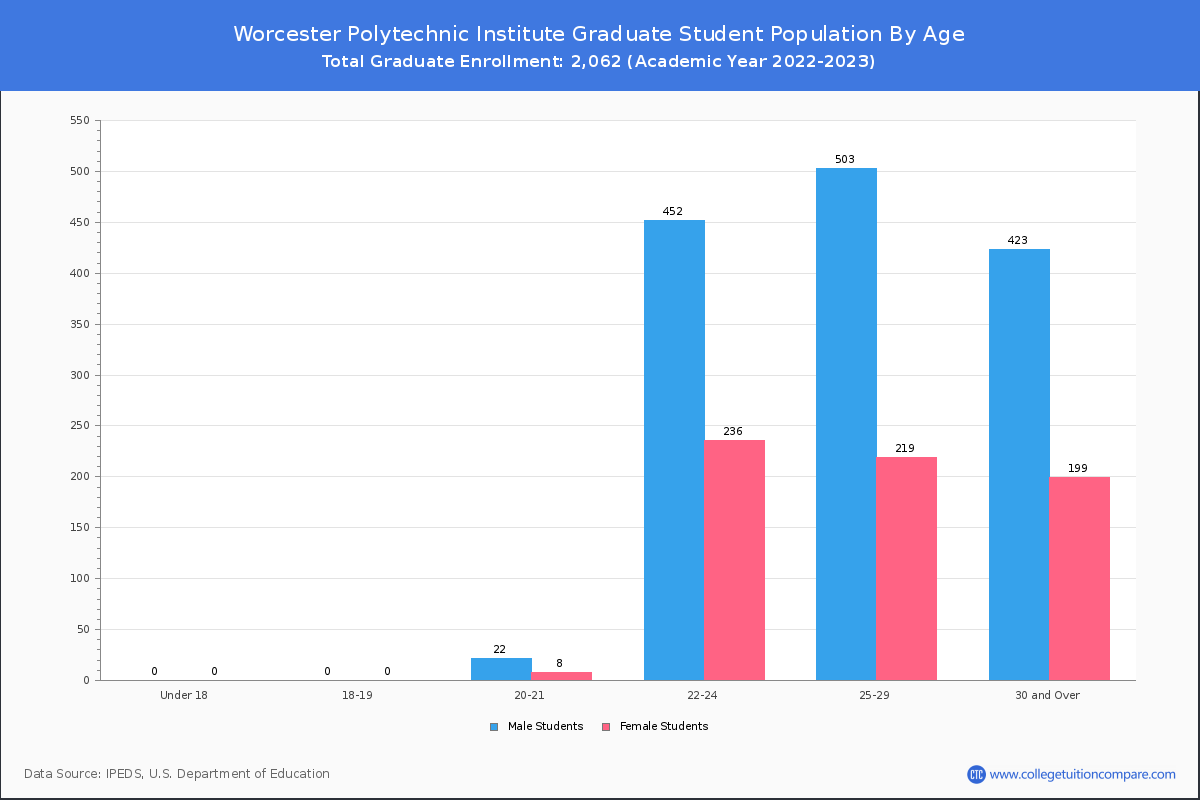
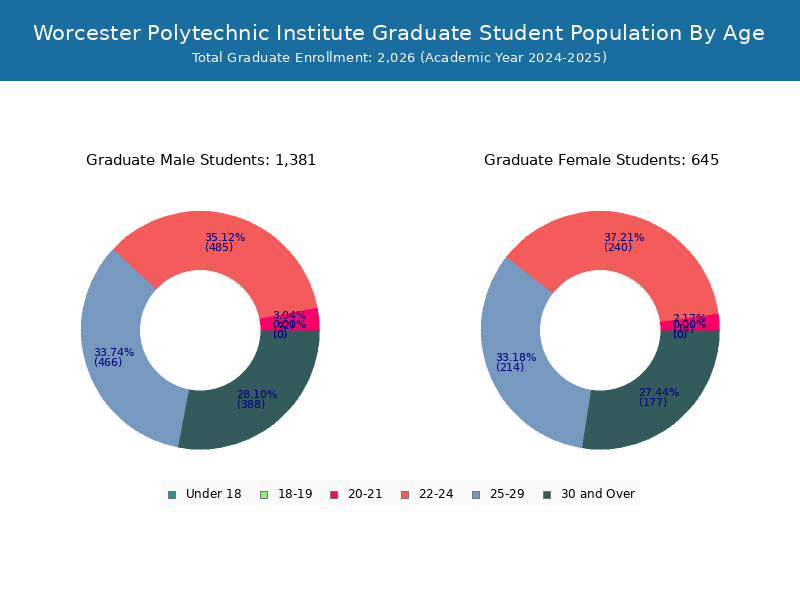
Student Age Distribution
By age, WPI has 107 students under 18 years old and 6 students over 65 years old. There are 5,930 students under 25 years old, and 1,378 students over 25 years old out of 7,308 total students.
WPI has 5,212 undergraduate students aged under 25 and 34 students aged 25 and over.
It has 718 graduate students aged under 25 and 1,344 students aged 25 and over.
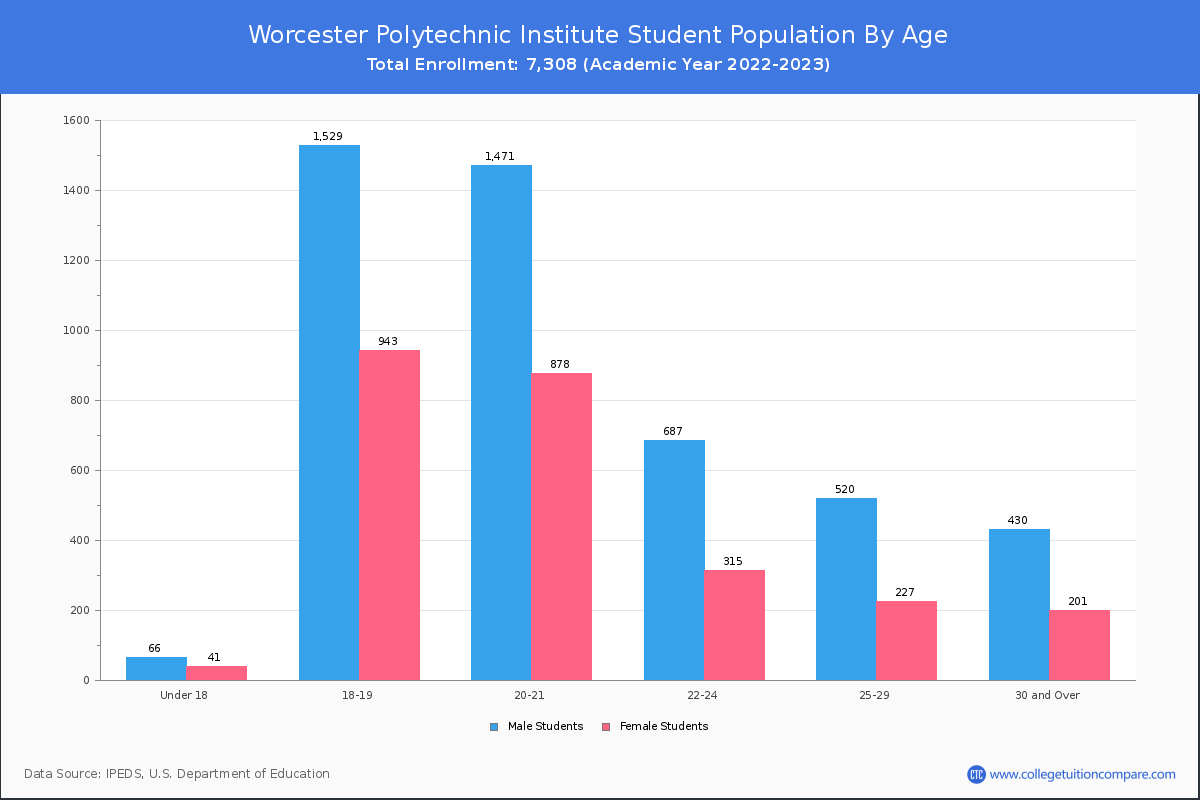
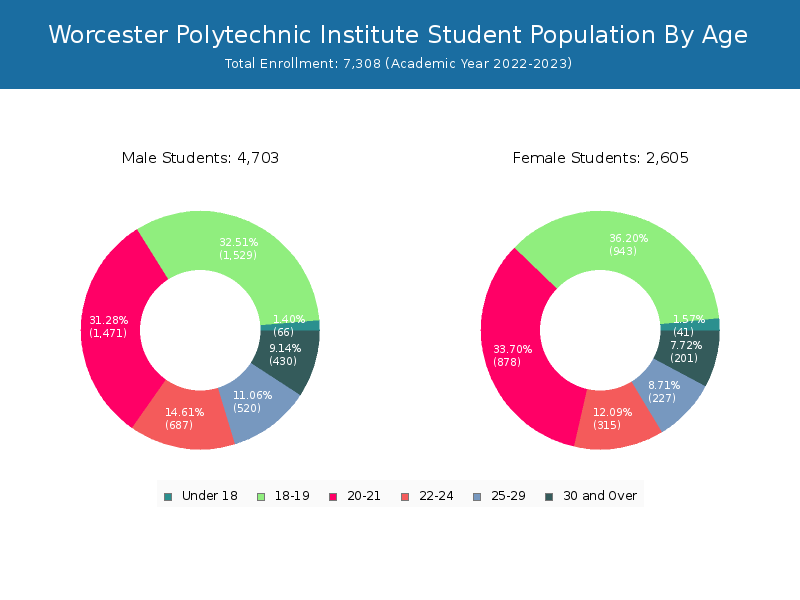
| Age | Total | Men | Women |
|---|---|---|---|
| Under 18 | 107 | 41 | 66 |
| 18-19 | 2,472 | 943 | 1,529 |
| 20-21 | 2,349 | 878 | 1,471 |
| 22-24 | 1,002 | 315 | 687 |
| 25-29 | 747 | 227 | 520 |
| 30-34 | 285 | 90 | 195 |
| 35-39 | 117 | 36 | 81 |
| 40-49 | 148 | 52 | 96 |
| 50-64 | 75 | 20 | 55 |
| Over 65 | 6 | 3 | 3 |
| Age | Total | Men | Women |
|---|---|---|---|
| Under 18 | 107 | 41 | 66 |
| 18-19 | 2,472 | 943 | 1,529 |
| 20-21 | 2,319 | 870 | 1,449 |
| 22-24 | 314 | 79 | 235 |
| 25-29 | 25 | 8 | 17 |
| 30-34 | 6 | 1 | 5 |
| 35-39 | 1 | 0 | 1 |
| 40-49 | 1 | 0 | 1 |
| 50-64 | 1 | 1 | 0 |
| Age | Total | Men | Women |
|---|
Online Student Enrollment
Distance learning, also called online education, is very attractive to students, especially who want to continue education and work in field. At Worcester Polytechnic Institute, 806 students are enrolled exclusively in online courses and 729 students are enrolled in some online courses.
352 students lived in Massachusetts or jurisdiction in which the school is located are enrolled exclusively in online courses and 454 students live in other State or outside of the United States.
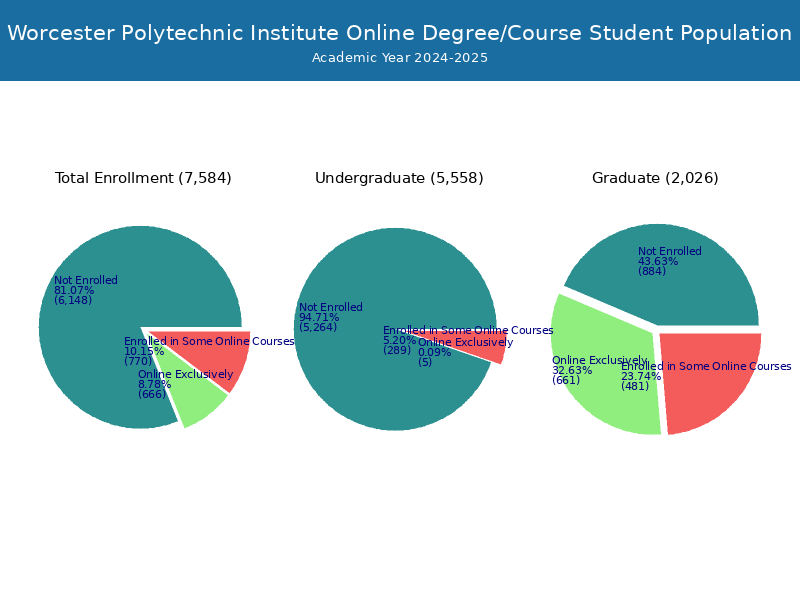
| All Students | Enrolled Exclusively Online Courses | Enrolled in Some Online Courses | |
|---|---|---|---|
| All Students | 7,308 | 806 | 729 |
| Undergraduate | 5,246 | 6 | 291 |
| Graduate | 2,062 | 800 | 438 |
| Massachusetts Residents | Other States in U.S. | Outside of U.S. | |
|---|---|---|---|
| All Students | 352 | 444 | 10 |
| Undergraduate | 2 | 4 | 0 |
| Graduate | 350 | 440 | 10 |
Transfer-in Students (Undergraduate)
Among 5,246 enrolled in undergraduate programs, 63 students have transferred-in from other institutions. The percentage of transfer-in students is 1.20%.
| Number of Students | |
|---|---|
| Regular Full-time | 5,052 |
| Transfer-in Full-time | 63 |