Student Population by Gender
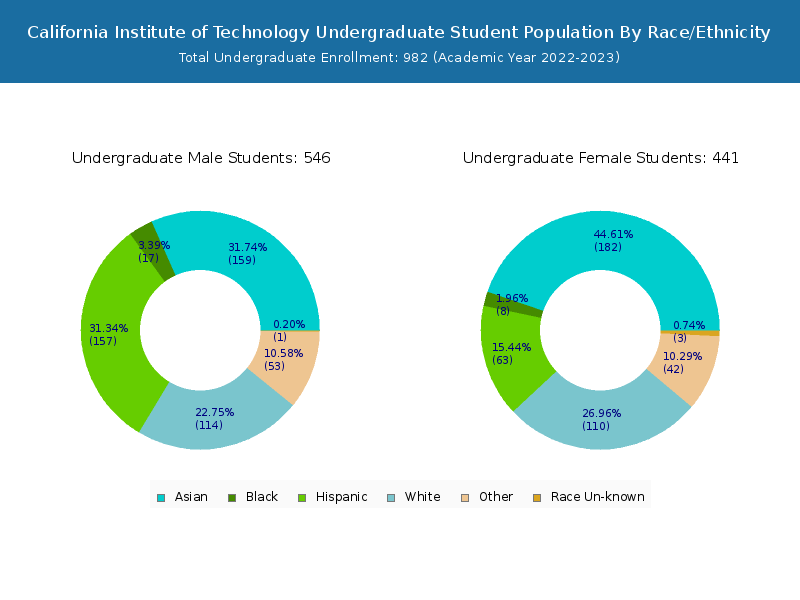
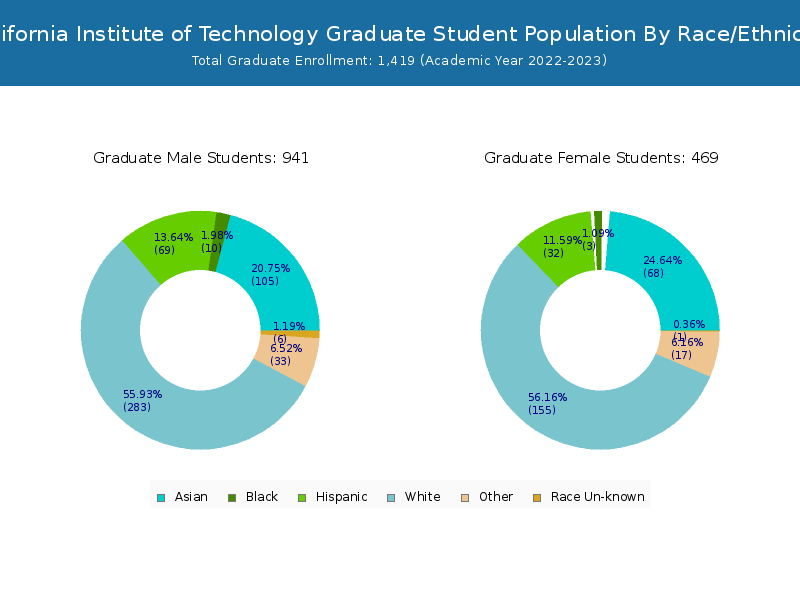
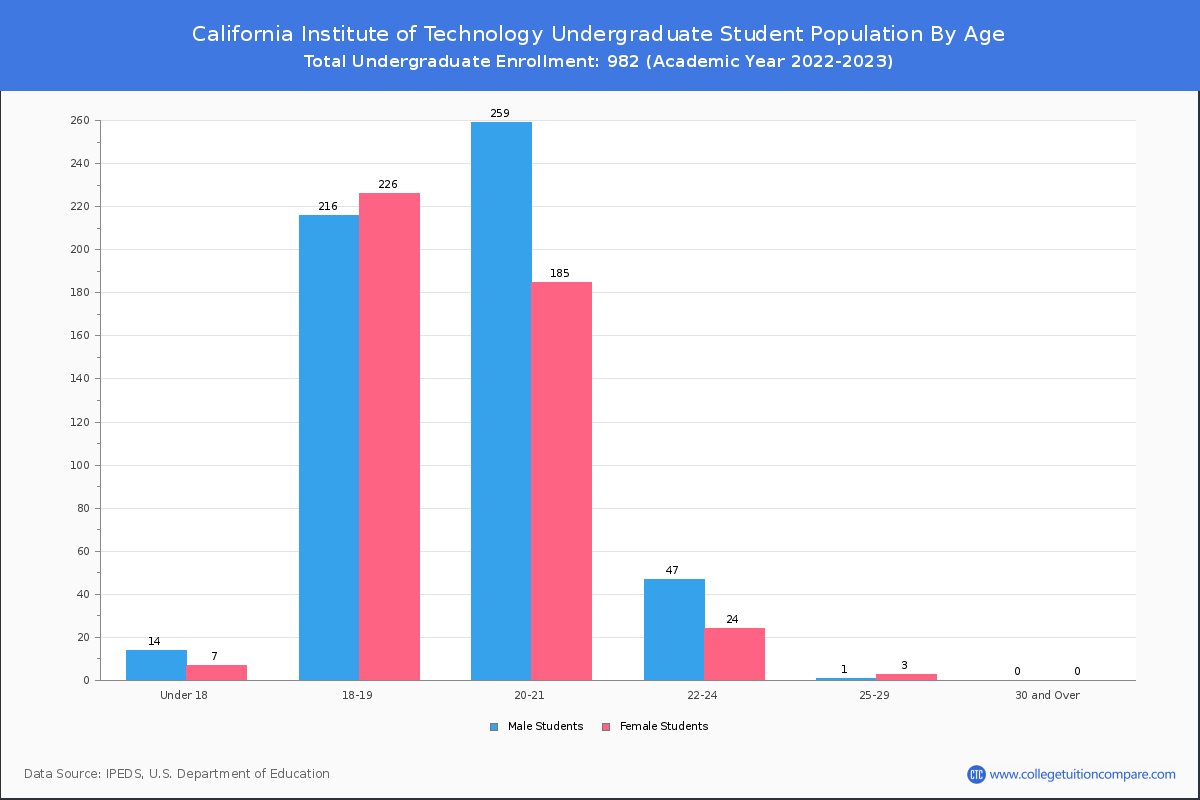
California Institute of Technology has a total of 2,401 enrolled students for the academic year 2022-2023. 982 students have enrolled in undergraduate programs and 1,419 students joined graduate programs.
By gender, 1,464 male and 937 female students (the male-female ratio is 61:39) are attending the school. The gender distribution is based on the 2022-2023 data.
| Total | Undergraduate | Graduate | |
|---|---|---|---|
| Total | 2,401 | 982 | 1,419 |
| Men | 1,464 | 537 | 927 |
| Women | 937 | 445 | 492 |

Student Distribution by Race/Ethnicity
By race/ethnicity, 641 White, 53 Black, and 517 Asian students out of a total of 2,401 are attending at California Institute of Technology. Comprehensive enrollment statistic data by race/ethnicity is shown in the next chart (Academic year 2022-2023 data).
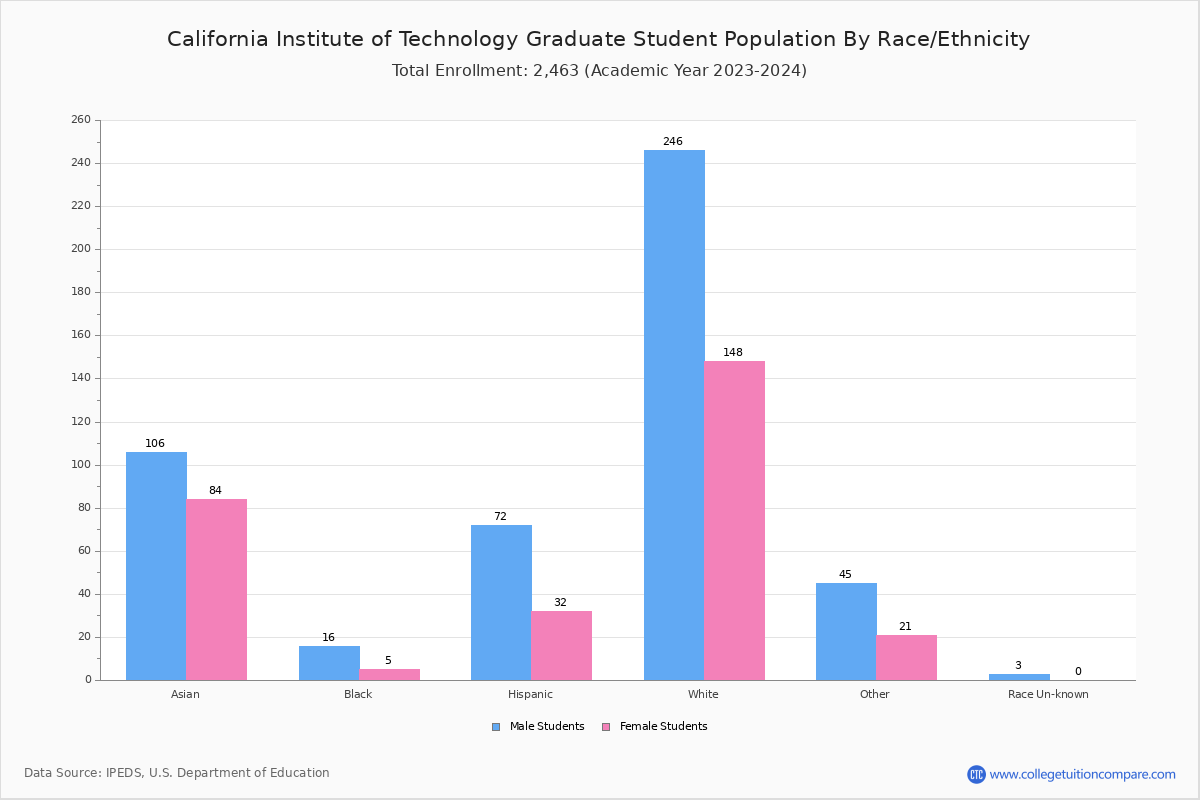
| Race | Total | Men | Women |
|---|---|---|---|
| American Indian or Native American | 2 | 2 | 0 |
| Asian | 517 | 272 | 245 |
| Black | 53 | 33 | 20 |
| Hispanic | 315 | 224 | 91 |
| Native Hawaiian or Other Pacific Islanders | 1 | 1 | 0 |
| White | 641 | 369 | 272 |
| Two or more races | 143 | 84 | 59 |
| Race Unknown | 11 | 6 | 5 |
| Race | Total | Men | Women |
|---|---|---|---|
| American Indian or Native American | 1 | 1 | 0 |
| Asian | 338 | 168 | 170 |
| Black | 34 | 19 | 15 |
| Hispanic | 216 | 152 | 64 |
| Native Hawaiian or Other Pacific Islanders | 1 | 1 | 0 |
| White | 208 | 99 | 109 |
| Two or more races | 87 | 46 | 41 |
| Race Unknown | 5 | 1 | 4 |
| Race | Total | Men | Women |
|---|---|---|---|
| American Indian or Native American | 0 | 0 | 0 |
| Asian | 5 | 4 | 1 |
| Black | 0 | 0 | 0 |
| Hispanic | 1 | 0 | 1 |
| Native Hawaiian or Other Pacific Islanders | 0 | 0 | 0 |
| White | 0 | 0 | 0 |
| Two or more races | 0 | 0 | 0 |
| Race Unknown | 0 | 0 | 0 |
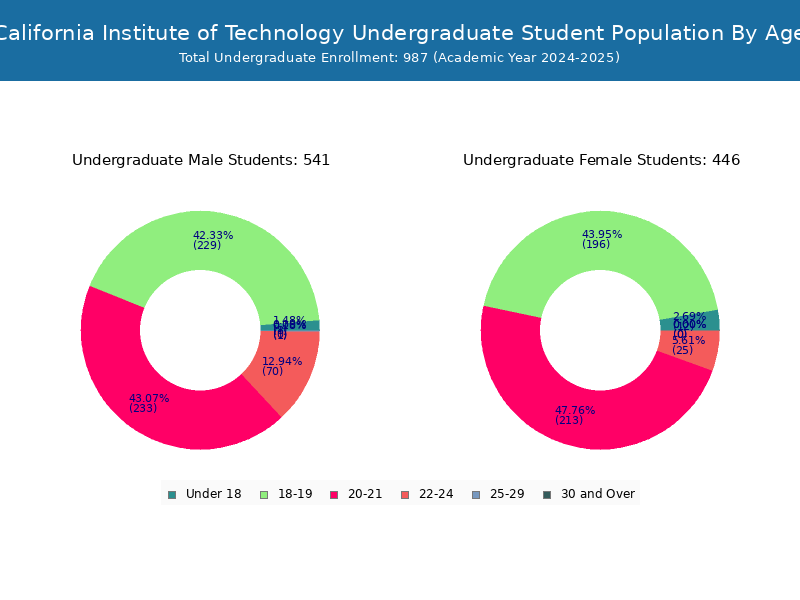
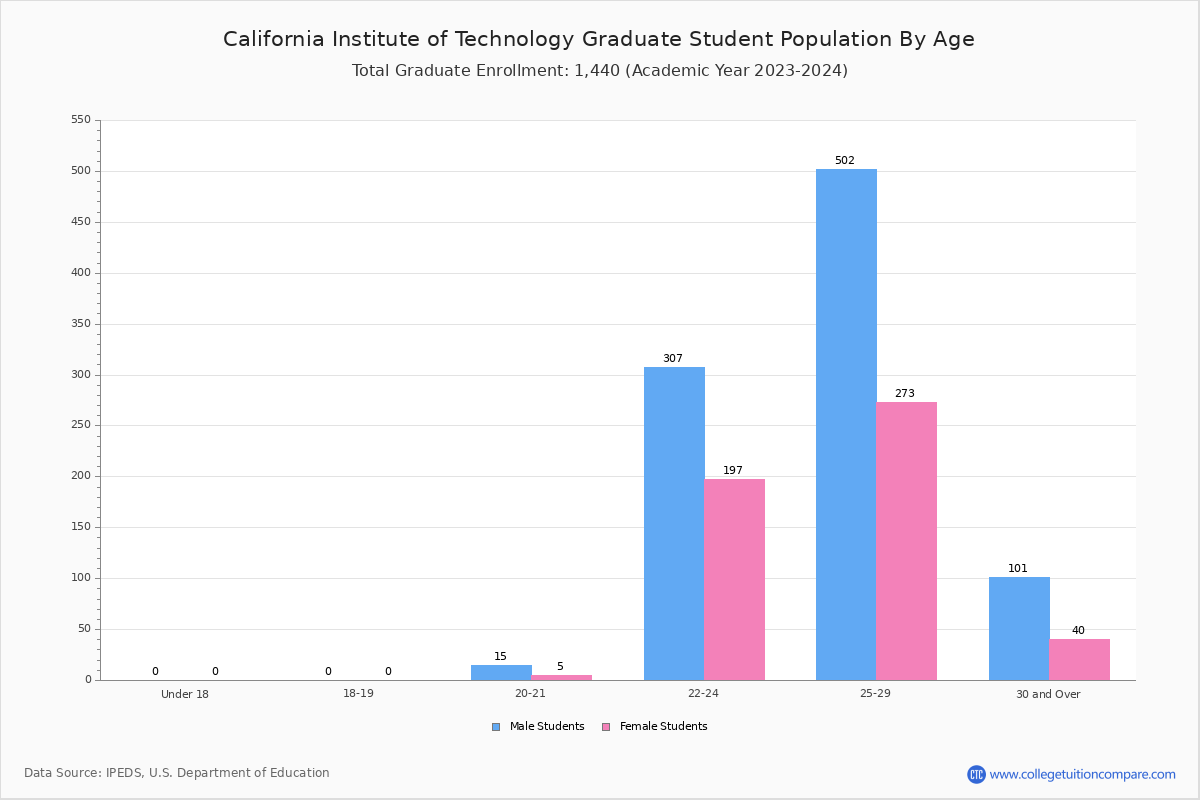
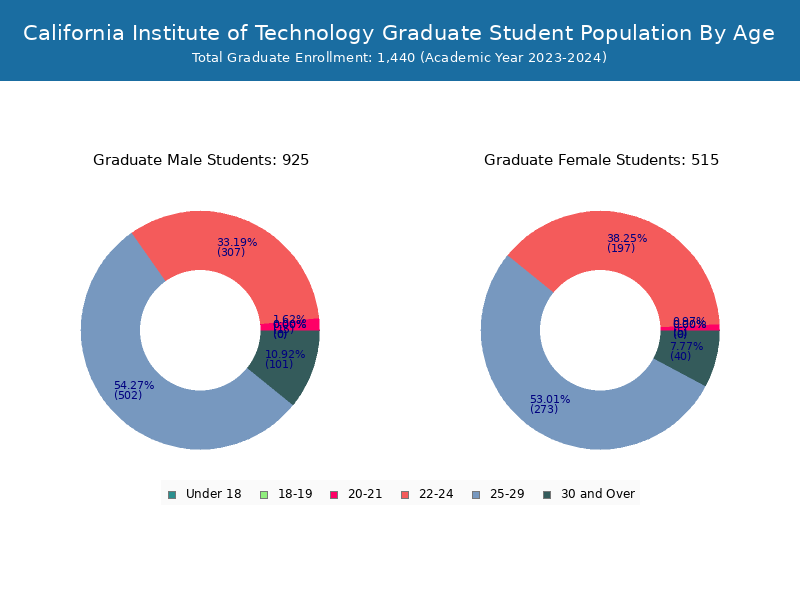
Student Age Distribution
There are 1,501 students under 25 years old, and 900 students over 25 years old out of 2,401 total students.
Caltech has 978 undergraduate students aged under 25 and 4 students aged 25 and over.
It has 523 graduate students aged under 25 and 896 students aged 25 and over.
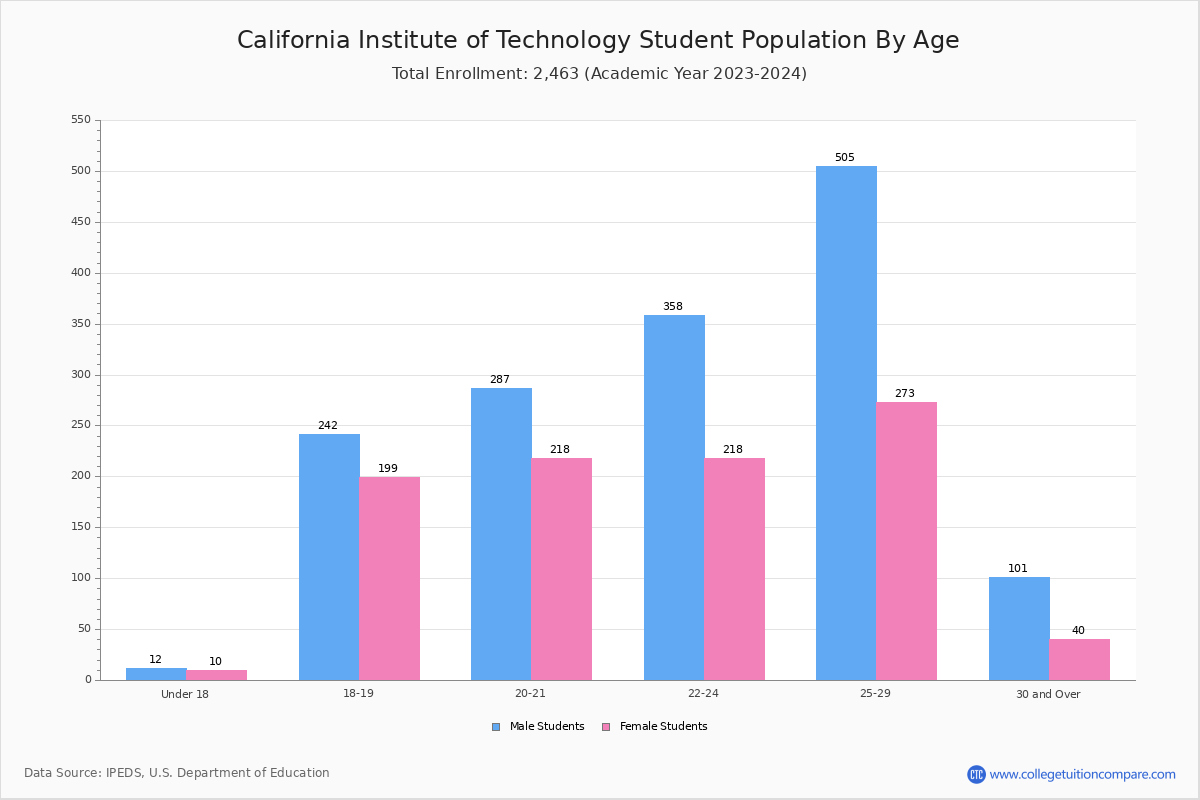
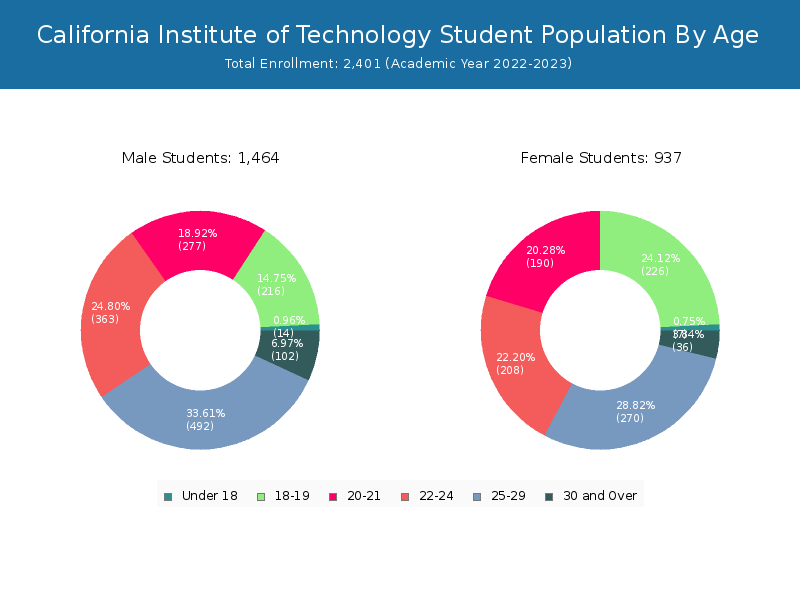
| Age | Total | Men | Women |
|---|---|---|---|
| Under 18 | 21 | 7 | 14 |
| 18-19 | 442 | 226 | 216 |
| 20-21 | 467 | 190 | 277 |
| 22-24 | 571 | 208 | 363 |
| 25-29 | 762 | 270 | 492 |
| 30-34 | 123 | 31 | 92 |
| 35-39 | 13 | 4 | 9 |
| 40-49 | 2 | 1 | 1 |
| Age | Total | Men | Women |
|---|---|---|---|
| Under 18 | 21 | 7 | 14 |
| 18-19 | 442 | 226 | 216 |
| 20-21 | 444 | 185 | 259 |
| 22-24 | 71 | 24 | 47 |
| 25-29 | 4 | 3 | 1 |
| Age | Total | Men | Women |
|---|
Transfer-in Students (Undergraduate)
Among 982 enrolled in undergraduate programs, 8 students have transferred-in from other institutions. The percentage of transfer-in students is 0.81%.
| Number of Students | |
|---|---|
| Regular Full-time | 974 |
| Transfer-in Full-time | 8 |