Student Population by Gender
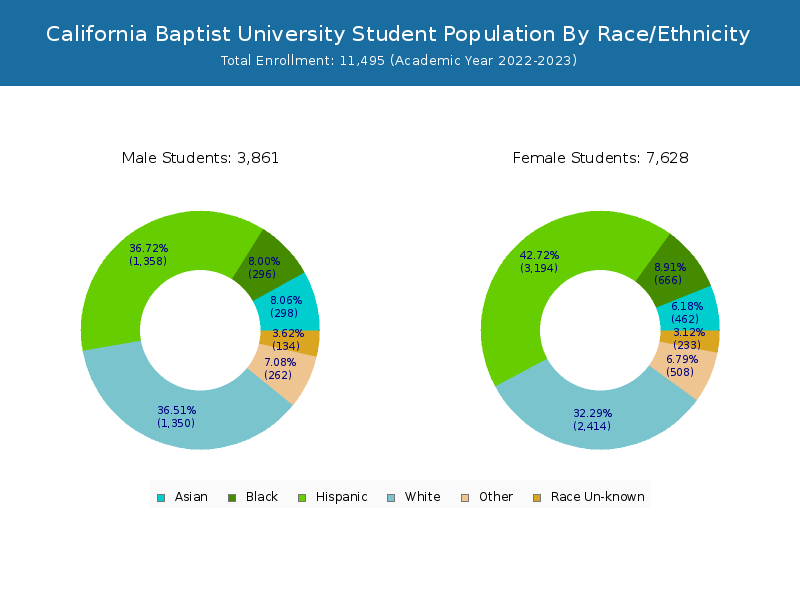
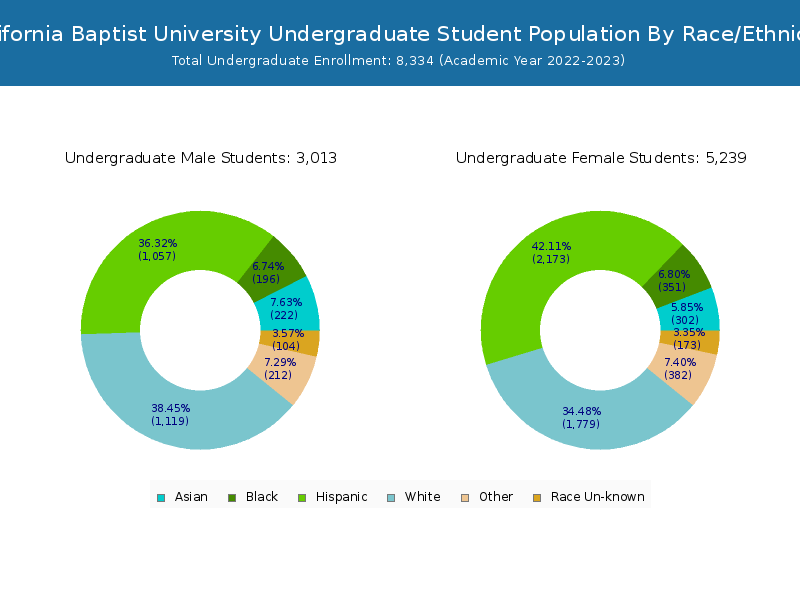
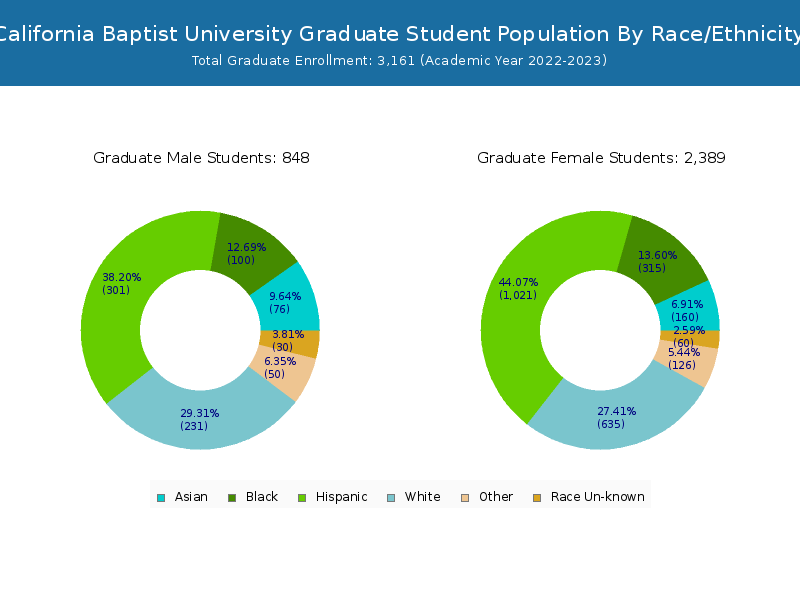
California Baptist University has a total of 11,495 enrolled students for the academic year 2022-2023. 8,334 students have enrolled in undergraduate programs and 3,161 students joined graduate programs.
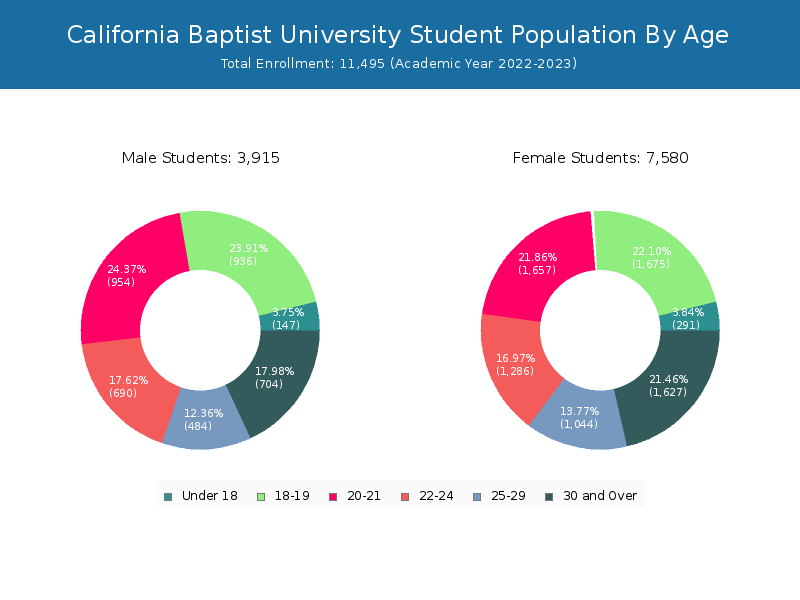
By gender, 3,915 male and 7,580 female students (the male-female ratio is 34:66) are attending the school. The gender distribution is based on the 2022-2023 data.
| Total | Undergraduate | Graduate | |
|---|---|---|---|
| Total | 11,495 | 8,334 | 3,161 |
| Men | 3,915 | 3,057 | 858 |
| Women | 7,580 | 5,277 | 2,303 |
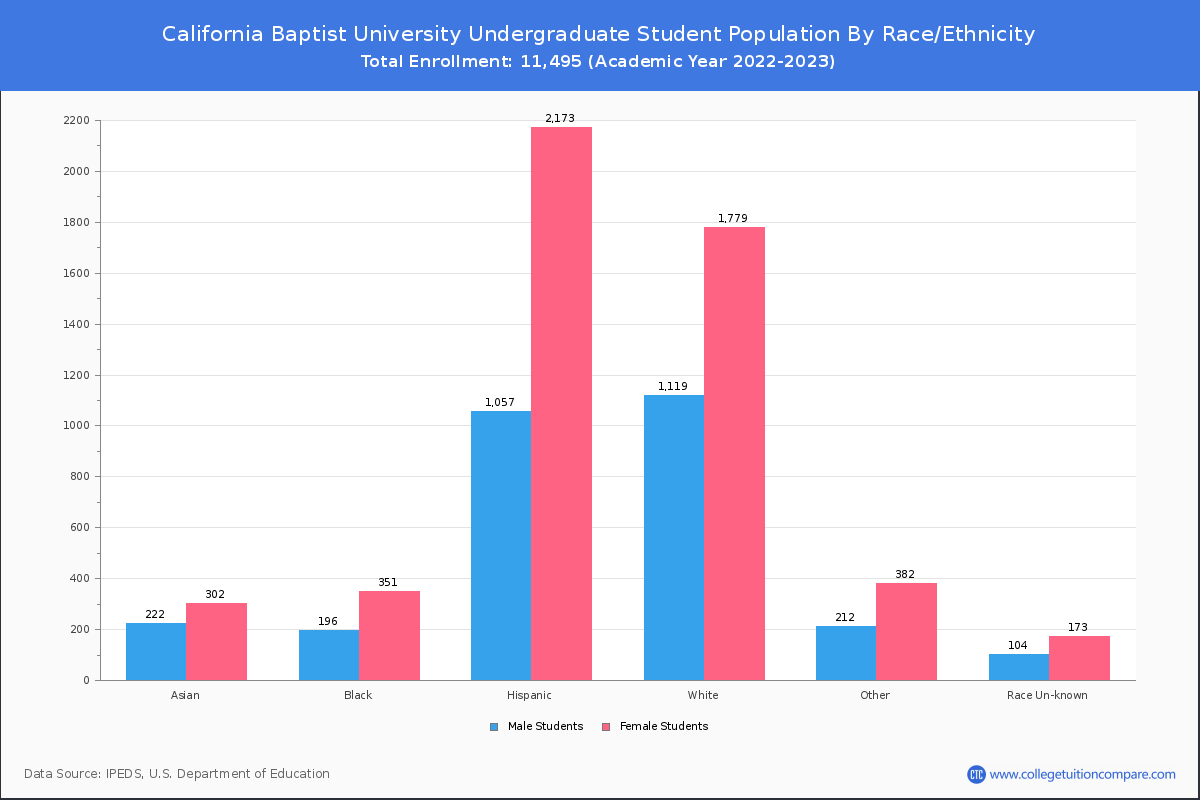
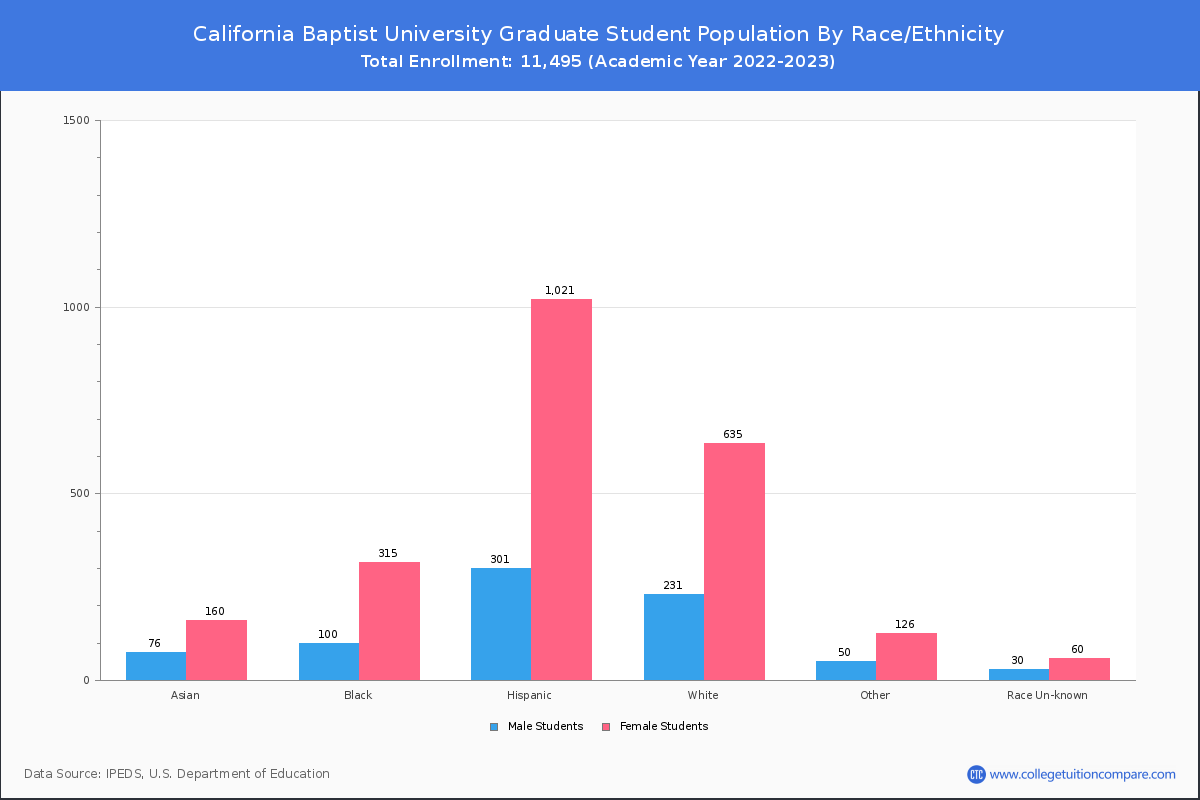
Student Distribution by Race/Ethnicity
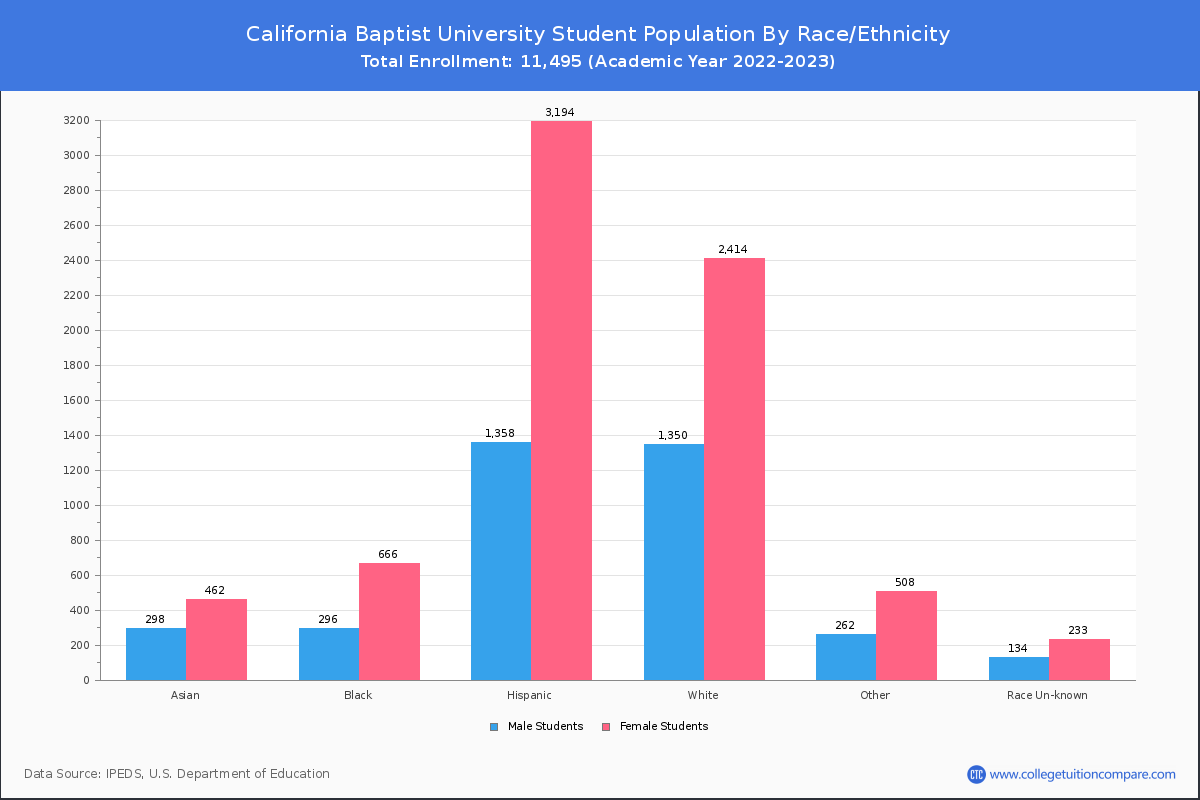
By race/ethnicity, 3,736 White, 968 Black, and 723 Asian students out of a total of 11,495 are attending at California Baptist University. Comprehensive enrollment statistic data by race/ethnicity is shown in the next chart (Academic year 2022-2023 data).
| Race | Total | Men | Women |
|---|---|---|---|
| American Indian or Native American | 63 | 19 | 44 |
| Asian | 723 | 270 | 453 |
| Black | 968 | 305 | 663 |
| Hispanic | 4,620 | 1,402 | 3,218 |
| Native Hawaiian or Other Pacific Islanders | 86 | 37 | 49 |
| White | 3,736 | 1,364 | 2,372 |
| Two or more races | 611 | 225 | 386 |
| Race Unknown | 388 | 164 | 224 |
| Race | Total | Men | Women |
|---|---|---|---|
| American Indian or Native American | 49 | 17 | 32 |
| Asian | 508 | 209 | 299 |
| Black | 552 | 206 | 346 |
| Hispanic | 3,327 | 1,099 | 2,228 |
| Native Hawaiian or Other Pacific Islanders | 59 | 27 | 32 |
| White | 2,891 | 1,098 | 1,793 |
| Two or more races | 485 | 186 | 299 |
| Race Unknown | 290 | 130 | 160 |
| Race | Total | Men | Women |
|---|---|---|---|
| American Indian or Native American | 6 | 2 | 4 |
| Asian | 57 | 18 | 39 |
| Black | 72 | 28 | 44 |
| Hispanic | 394 | 123 | 271 |
| Native Hawaiian or Other Pacific Islanders | 7 | 4 | 3 |
| White | 376 | 142 | 234 |
| Two or more races | 66 | 26 | 40 |
| Race Unknown | 35 | 17 | 18 |
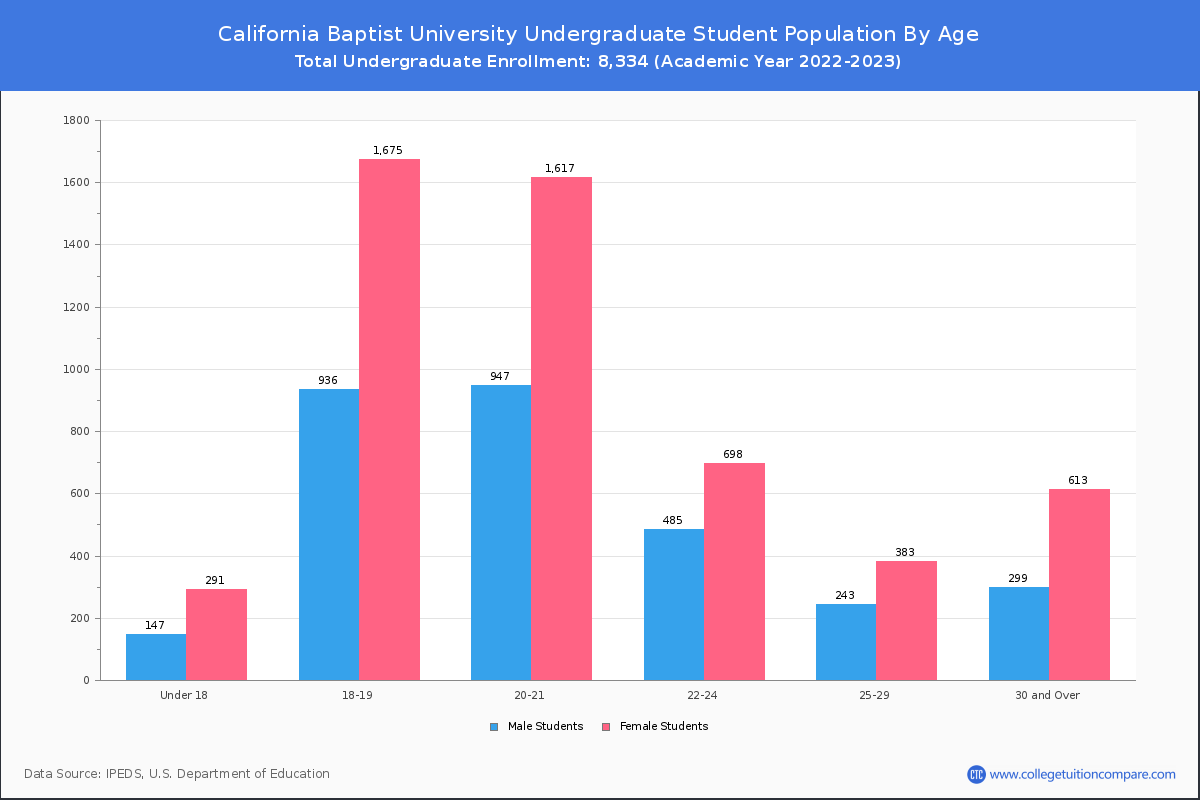
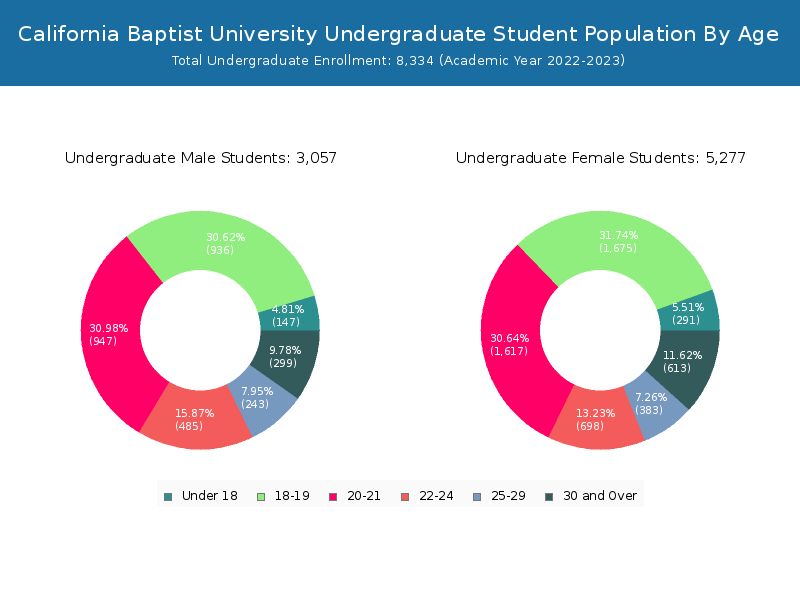
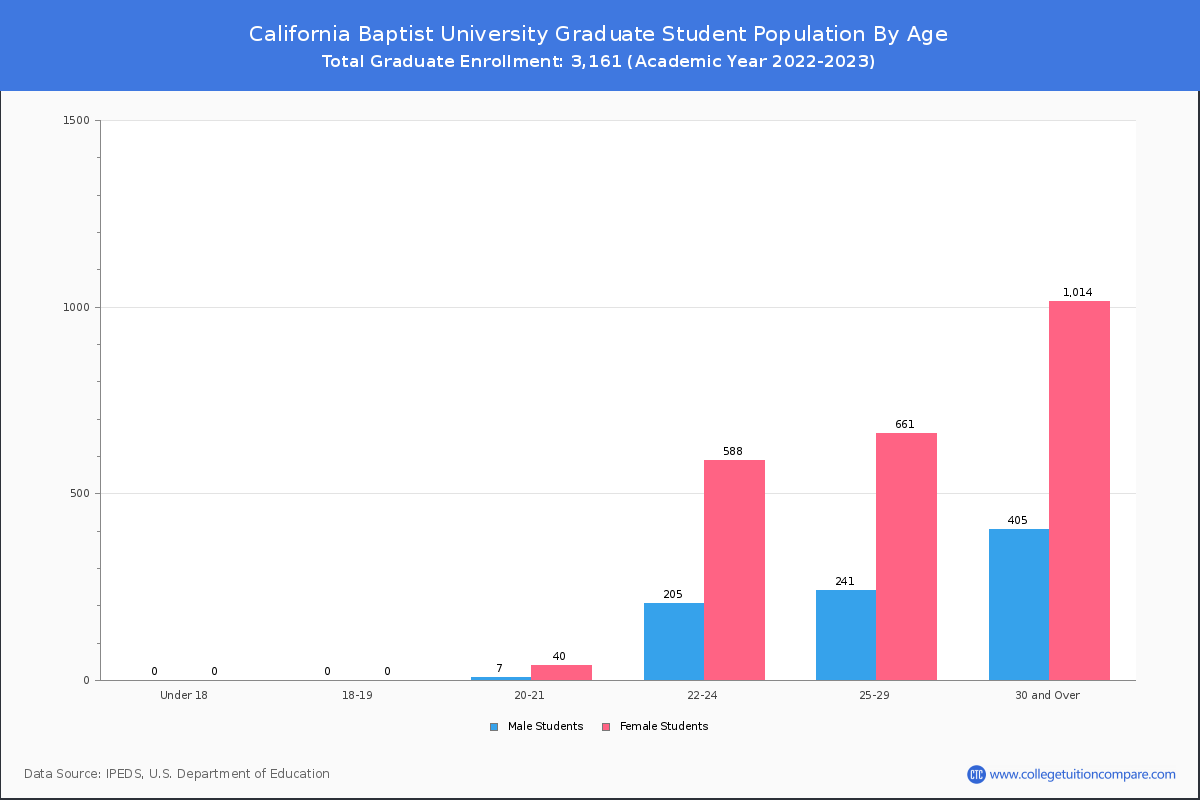
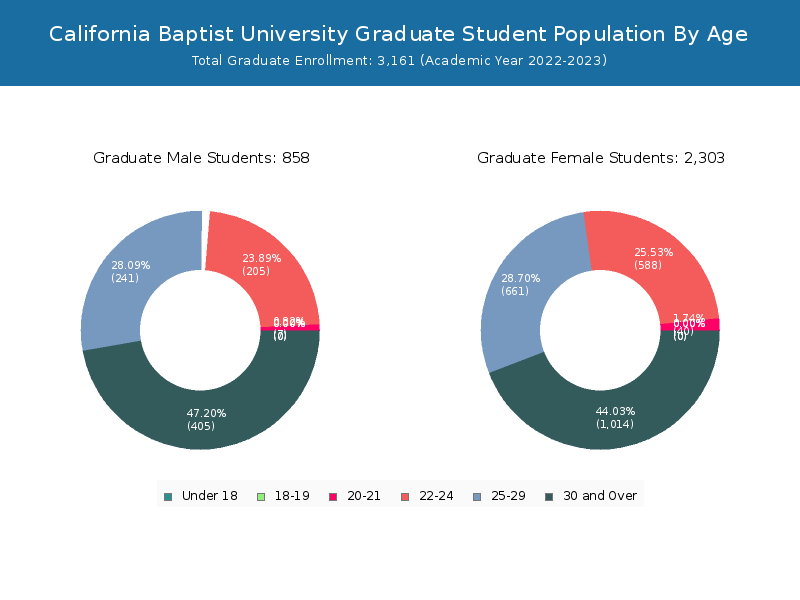
Student Age Distribution
By age, CBU has 438 students under 18 years old and 9 students over 65 years old. There are 7,636 students under 25 years old, and 3,859 students over 25 years old out of 11,495 total students.
CBU has 6,796 undergraduate students aged under 25 and 1,538 students aged 25 and over.
It has 840 graduate students aged under 25 and 2,321 students aged 25 and over.
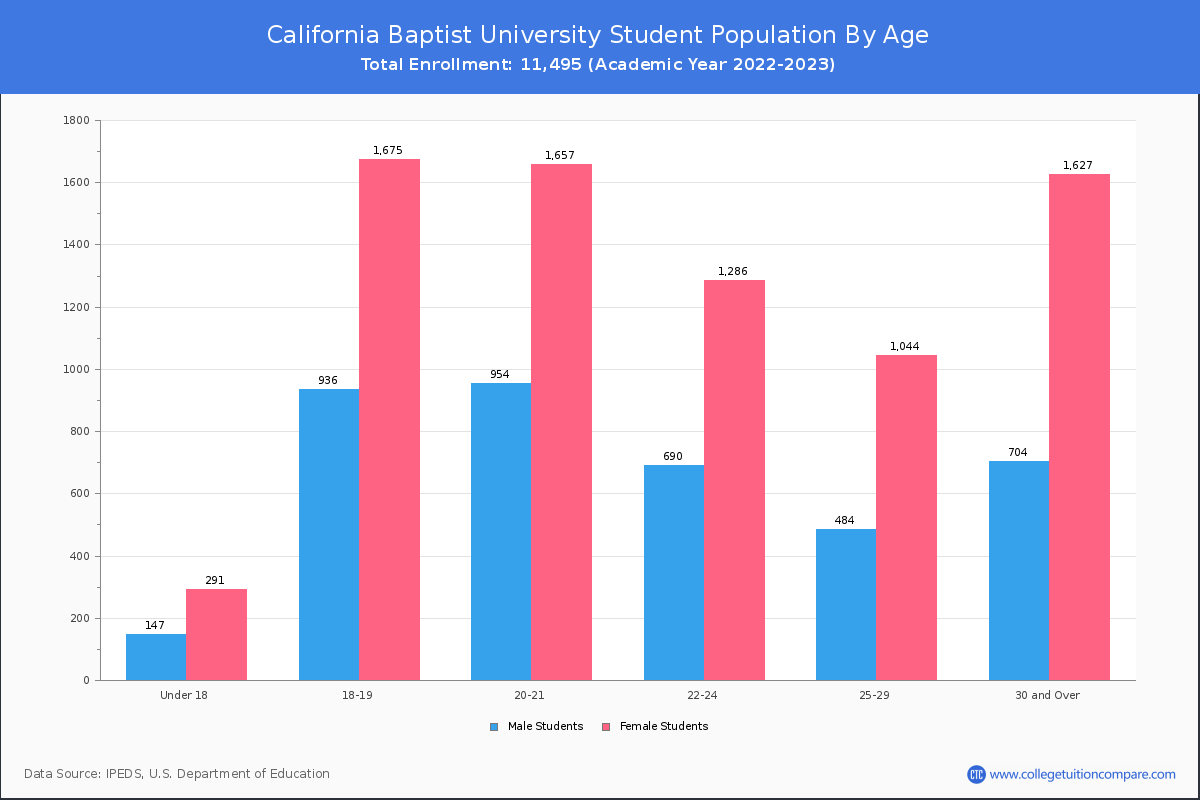
| Age | Total | Men | Women |
|---|---|---|---|
| Under 18 | 438 | 291 | 147 |
| 18-19 | 2,611 | 1,675 | 936 |
| 20-21 | 2,611 | 1,657 | 954 |
| 22-24 | 1,976 | 1,286 | 690 |
| 25-29 | 1,528 | 1,044 | 484 |
| 30-34 | 868 | 592 | 276 |
| 35-39 | 542 | 387 | 155 |
| 40-49 | 648 | 451 | 197 |
| 50-64 | 264 | 191 | 73 |
| Over 65 | 9 | 6 | 3 |
| Age | Total | Men | Women |
|---|---|---|---|
| Under 18 | 438 | 291 | 147 |
| 18-19 | 2,611 | 1,675 | 936 |
| 20-21 | 2,564 | 1,617 | 947 |
| 22-24 | 1,183 | 698 | 485 |
| 25-29 | 626 | 383 | 243 |
| 30-34 | 378 | 239 | 139 |
| 35-39 | 235 | 167 | 68 |
| 40-49 | 225 | 155 | 70 |
| 50-64 | 74 | 52 | 22 |
| Age | Total | Men | Women |
|---|
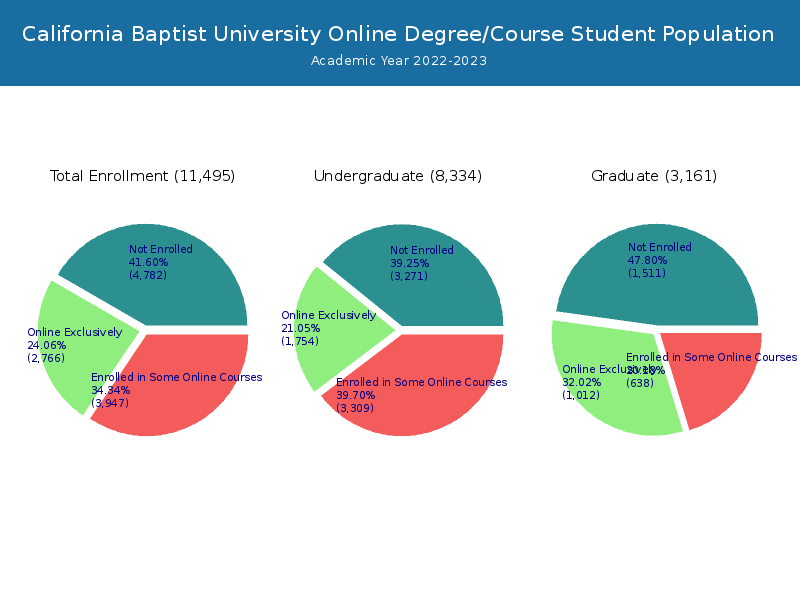
Online Student Enrollment
Distance learning, also called online education, is very attractive to students, especially who want to continue education and work in field. At California Baptist University, 2,766 students are enrolled exclusively in online courses and 3,947 students are enrolled in some online courses.
2,415 students lived in California or jurisdiction in which the school is located are enrolled exclusively in online courses and 351 students live in other State or outside of the United States.
| All Students | Enrolled Exclusively Online Courses | Enrolled in Some Online Courses | |
|---|---|---|---|
| All Students | 11,495 | 2,766 | 3,947 |
| Undergraduate | 8,334 | 1,754 | 3,309 |
| Graduate | 3,161 | 1,012 | 638 |
| California Residents | Other States in U.S. | Outside of U.S. | |
|---|---|---|---|
| All Students | 2,415 | 331 | 20 |
| Undergraduate | 1,543 | 204 | 7 |
| Graduate | 872 | 127 | 13 |
Transfer-in Students (Undergraduate)
Among 8,334 enrolled in undergraduate programs, 1,033 students have transferred-in from other institutions. The percentage of transfer-in students is 12.40%.902 students have transferred in as full-time status and 131 students transferred in as part-time status.
| Number of Students | |
|---|---|
| Regular Full-time | 6,330 |
| Transfer-in Full-time | 902 |
| Regular Part-time | 971 |
| Transfer-in Part-time | 131 |