Student Population by Gender
University of South Alabama has a total of 13,438 enrolled students for the academic year 2022-2023. 8,480 students have enrolled in undergraduate programs and 4,958 students joined graduate programs.
By gender, 4,284 male and 9,154 female students (the male-female ratio is 32:68) are attending the school. The gender distribution is based on the 2022-2023 data.
| Total | Undergraduate | Graduate | |
|---|---|---|---|
| Total | 13,438 | 8,480 | 4,958 |
| Men | 4,284 | 3,267 | 1,017 |
| Women | 9,154 | 5,213 | 3,941 |
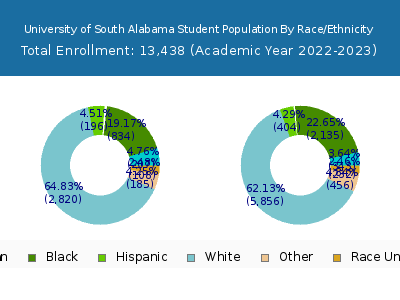
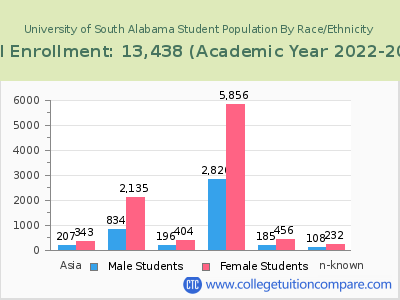
Student Distribution by Race/Ethnicity
| Race | Total | Men | Women |
|---|---|---|---|
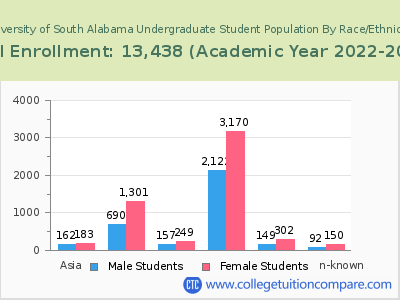
| American Indian or Native American | 91 | 30 | 61 |
| Asian | 522 | 216 | 306 |
| Black | 2,835 | 765 | 2,070 |
| Hispanic | 571 | 192 | 379 |
| Native Hawaiian or Other Pacific Islanders | 23 | 9 | 14 |
| White | 8,306 | 2,687 | 5,619 |
| Two or more races | 516 | 146 | 370 |
| Race Unknown | 301 | 95 | 206 |
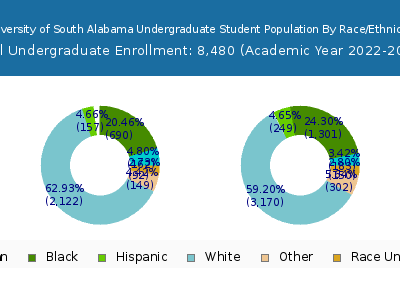
| Race | Total | Men | Women |
|---|---|---|---|
| American Indian or Native American | 62 | 23 | 39 |
| Asian | 339 | 170 | 169 |
| Black | 1,900 | 628 | 1,272 |
| Hispanic | 398 | 160 | 238 |
| Native Hawaiian or Other Pacific Islanders | 10 | 4 | 6 |
| White | 5,099 | 2,022 | 3,077 |
| Two or more races | 368 | 125 | 243 |
| Race Unknown | 186 | 73 | 113 |
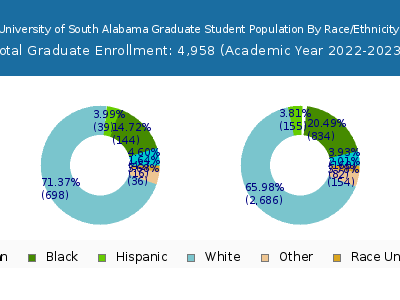
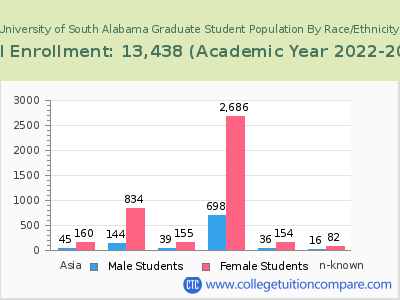
| Race | Total | Men | Women |
|---|---|---|---|
| American Indian or Native American | 11 | 5 | 6 |
| Asian | 11 | 2 | 9 |
| Black | 162 | 42 | 120 |
| Hispanic | 38 | 15 | 23 |
| Native Hawaiian or Other Pacific Islanders | 2 | 1 | 1 |
| White | 450 | 192 | 258 |
| Two or more races | 27 | 8 | 19 |
| Race Unknown | 7 | 5 | 2 |
Student Age Distribution
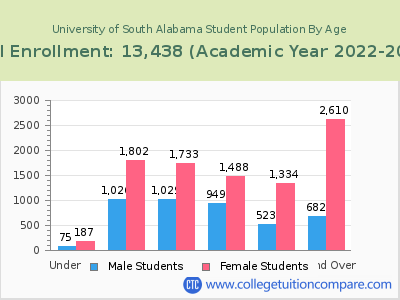
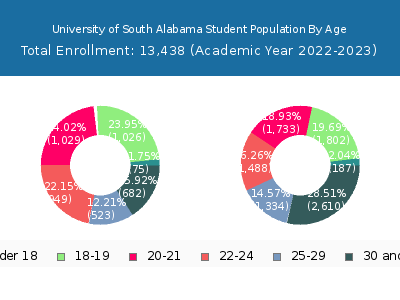
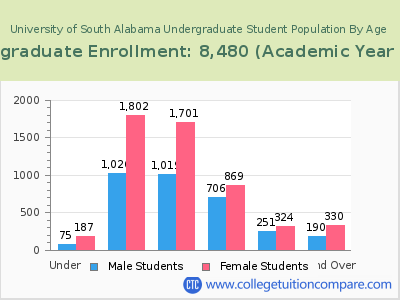
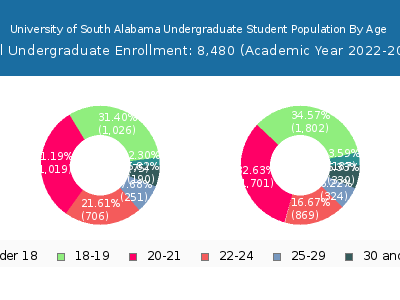
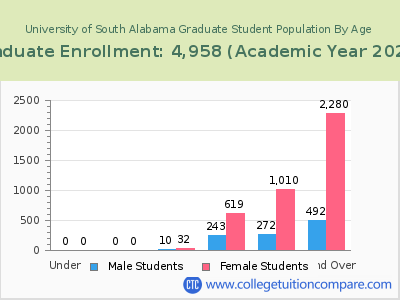
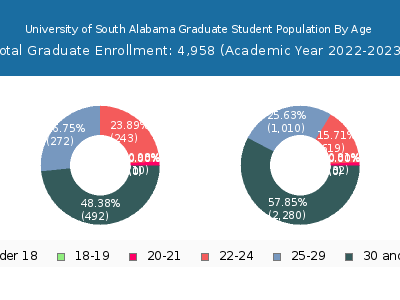
By age, U of South Alabama has 262 students under 18 years old and 12 students over 65 years old. There are 8,289 students under 25 years old, and 5,149 students over 25 years old out of 13,438 total students.
In undergraduate programs, 262 students are younger than 18 and 6 students are older than 65. U of South Alabama has 7,385 undergraduate students aged under 25 and 1,095 students aged 25 and over.
It has 904 graduate students aged under 25 and 4,054 students aged 25 and over.
| Age | Total | Men | Women |
|---|---|---|---|
| Under 18 | 262 | 187 | 75 |
| 18-19 | 2,828 | 1,802 | 1,026 |
| 20-21 | 2,762 | 1,733 | 1,029 |
| 22-24 | 2,437 | 1,488 | 949 |
| 25-29 | 1,857 | 1,334 | 523 |
| 30-34 | 1,188 | 933 | 255 |
| 35-39 | 827 | 666 | 161 |
| 40-49 | 910 | 732 | 178 |
| 50-64 | 355 | 273 | 82 |
| Over 65 | 12 | 6 | 6 |
| Age | Total | Men | Women |
|---|---|---|---|
| Under 18 | 262 | 187 | 75 |
| 18-19 | 2,828 | 1,802 | 1,026 |
| 20-21 | 2,720 | 1,701 | 1,019 |
| 22-24 | 1,575 | 869 | 706 |
| 25-29 | 575 | 324 | 251 |
| 30-34 | 209 | 125 | 84 |
| 35-39 | 123 | 77 | 46 |
| 40-49 | 118 | 81 | 37 |
| 50-64 | 64 | 44 | 20 |
| Over 65 | 6 | 3 | 3 |
| Age | Total | Men | Women |
|---|
Online Student Enrollment
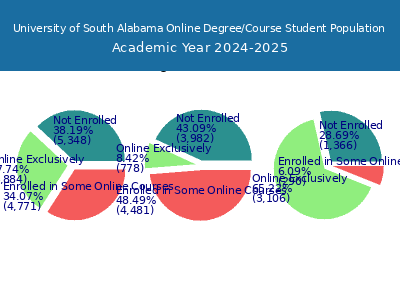
Distance learning, also called online education, is very attractive to students, especially who want to continue education and work in field. At University of South Alabama, 3,953 students are enrolled exclusively in online courses and 4,150 students are enrolled in some online courses.
1,166 students lived in Alabama or jurisdiction in which the school is located are enrolled exclusively in online courses and 2,787 students live in other State or outside of the United States.
| All Students | Enrolled Exclusively Online Courses | Enrolled in Some Online Courses | |
|---|---|---|---|
| All Students | 13,438 | 3,953 | 4,150 |
| Undergraduate | 8,480 | 615 | 3,925 |
| Graduate | 4,958 | 3,338 | 225 |
| Alabama Residents | Other States in U.S. | Outside of U.S. | |
|---|---|---|---|
| All Students | 1,166 | 2,771 | 16 |
| Undergraduate | 529 | 81 | 5 |
| Graduate | 637 | 2,690 | 11 |
Transfer-in Students (Undergraduate)
Among 8,480 enrolled in undergraduate programs, 714 students have transferred-in from other institutions. The percentage of transfer-in students is 8.42%.618 students have transferred in as full-time status and 96 students transferred in as part-time status.
| Number of Students | |
|---|---|
| Regular Full-time | 6,438 |
| Transfer-in Full-time | 618 |
| Regular Part-time | 1,328 |
| Transfer-in Part-time | 96 |
