Student Population by Gender
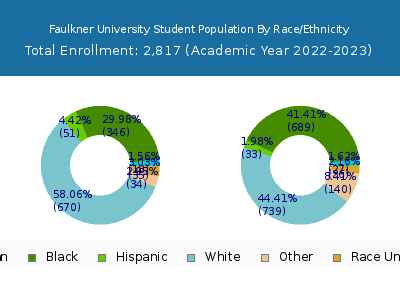
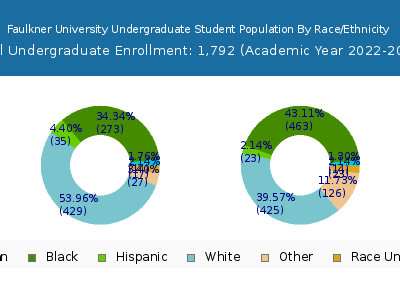
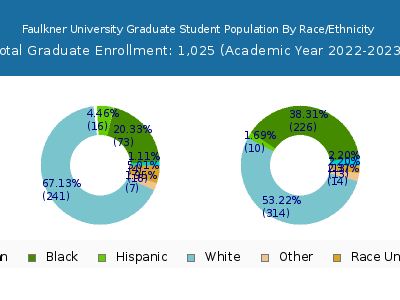
Faulkner University has a total of 2,817 enrolled students for the academic year 2022-2023. 1,792 students have enrolled in undergraduate programs and 1,025 students joined graduate programs.
By gender, 1,153 male and 1,664 female students (the male-female ratio is 41:59) are attending the school. The gender distribution is based on the 2022-2023 data.
| Total | Undergraduate | Graduate | |
|---|---|---|---|
| Total | 2,817 | 1,792 | 1,025 |
| Men | 1,153 | 794 | 359 |
| Women | 1,664 | 998 | 666 |
Student Distribution by Race/Ethnicity
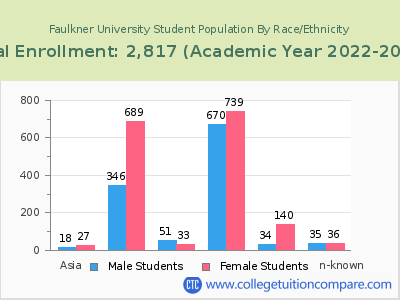
| Race | Total | Men | Women |
|---|---|---|---|
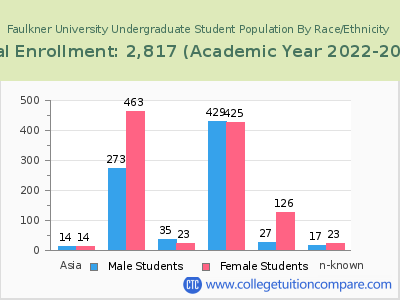
| American Indian or Native American | 17 | 7 | 10 |
| Asian | 42 | 13 | 29 |
| Black | 954 | 315 | 639 |
| Hispanic | 109 | 56 | 53 |
| Native Hawaiian or Other Pacific Islanders | 4 | 2 | 2 |
| White | 1,489 | 652 | 837 |
| Two or more races | 64 | 28 | 36 |
| Race Unknown | 66 | 33 | 33 |
| Race | Total | Men | Women |
|---|---|---|---|
| American Indian or Native American | 5 | 2 | 3 |
| Asian | 25 | 10 | 15 |
| Black | 678 | 244 | 434 |
| Hispanic | 76 | 41 | 35 |
| Native Hawaiian or Other Pacific Islanders | 4 | 2 | 2 |
| White | 852 | 409 | 443 |
| Two or more races | 50 | 24 | 26 |
| Race Unknown | 44 | 22 | 22 |
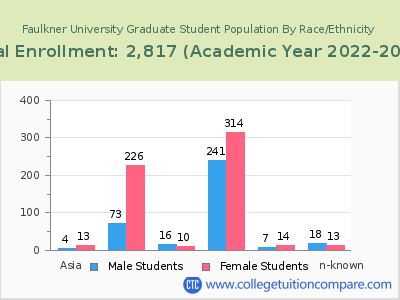
| Race | Total | Men | Women |
|---|---|---|---|
| American Indian or Native American | 1 | 0 | 1 |
| Asian | 1 | 0 | 1 |
| Black | 130 | 33 | 97 |
| Hispanic | 18 | 14 | 4 |
| Native Hawaiian or Other Pacific Islanders | 0 | 0 | 0 |
| White | 91 | 49 | 42 |
| Two or more races | 5 | 3 | 2 |
| Race Unknown | 16 | 8 | 8 |
Student Age Distribution
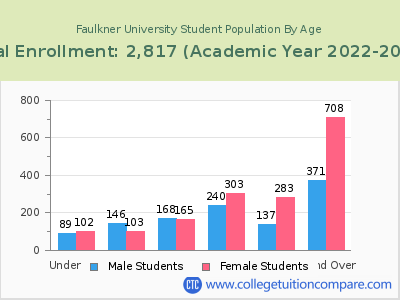
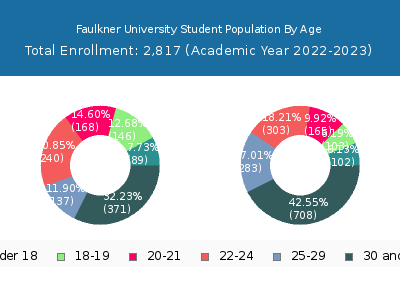
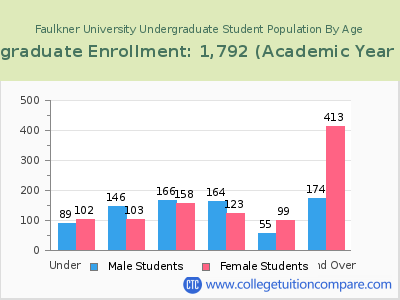
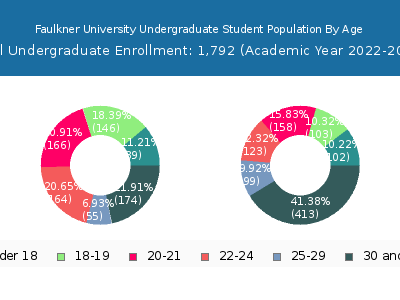
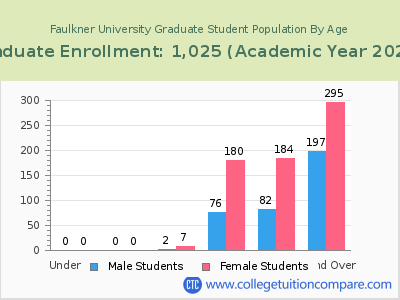
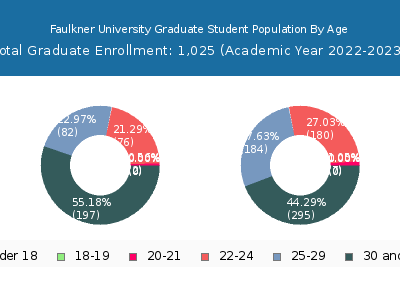
By age, Faulkner has 191 students under 18 years old and 6 students over 65 years old. There are 1,316 students under 25 years old, and 1,499 students over 25 years old out of 2,817 total students.
In undergraduate programs, 191 students are younger than 18 and 2 students are older than 65. Faulkner has 1,051 undergraduate students aged under 25 and 741 students aged 25 and over.
It has 265 graduate students aged under 25 and 758 students aged 25 and over.
| Age | Total | Men | Women |
|---|---|---|---|
| Under 18 | 191 | 102 | 89 |
| 18-19 | 249 | 103 | 146 |
| 20-21 | 333 | 165 | 168 |
| 22-24 | 543 | 303 | 240 |
| 25-29 | 420 | 283 | 137 |
| 30-34 | 309 | 192 | 117 |
| 35-39 | 239 | 156 | 83 |
| 40-49 | 338 | 231 | 107 |
| 50-64 | 187 | 126 | 61 |
| Over 65 | 6 | 3 | 3 |
| Age | Total | Men | Women |
|---|---|---|---|
| Under 18 | 191 | 102 | 89 |
| 18-19 | 249 | 103 | 146 |
| 20-21 | 324 | 158 | 166 |
| 22-24 | 287 | 123 | 164 |
| 25-29 | 154 | 99 | 55 |
| 30-34 | 160 | 111 | 49 |
| 35-39 | 143 | 95 | 48 |
| 40-49 | 178 | 134 | 44 |
| 50-64 | 104 | 72 | 32 |
| Over 65 | 2 | 1 | 1 |
| Age | Total | Men | Women |
|---|
Online Student Enrollment
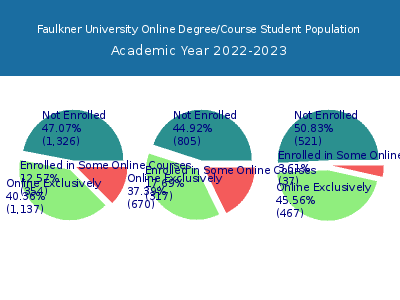
Distance learning, also called online education, is very attractive to students, especially who want to continue education and work in field. At Faulkner University, 1,137 students are enrolled exclusively in online courses and 354 students are enrolled in some online courses.
811 students lived in Alabama or jurisdiction in which the school is located are enrolled exclusively in online courses and 326 students live in other State or outside of the United States.
| All Students | Enrolled Exclusively Online Courses | Enrolled in Some Online Courses | |
|---|---|---|---|
| All Students | 2,817 | 1,137 | 354 |
| Undergraduate | 1,792 | 670 | 317 |
| Graduate | 1,025 | 467 | 37 |
| Alabama Residents | Other States in U.S. | Outside of U.S. | |
|---|---|---|---|
| All Students | 811 | 326 | 0 |
| Undergraduate | 501 | 169 | 0 |
| Graduate | 310 | 157 | 0 |
Transfer-in Students (Undergraduate)
Among 1,792 enrolled in undergraduate programs, 274 students have transferred-in from other institutions. The percentage of transfer-in students is 15.29%.200 students have transferred in as full-time status and 74 students transferred in as part-time status.
| Number of Students | |
|---|---|
| Regular Full-time | 1,007 |
| Transfer-in Full-time | 200 |
| Regular Part-time | 511 |
| Transfer-in Part-time | 74 |
