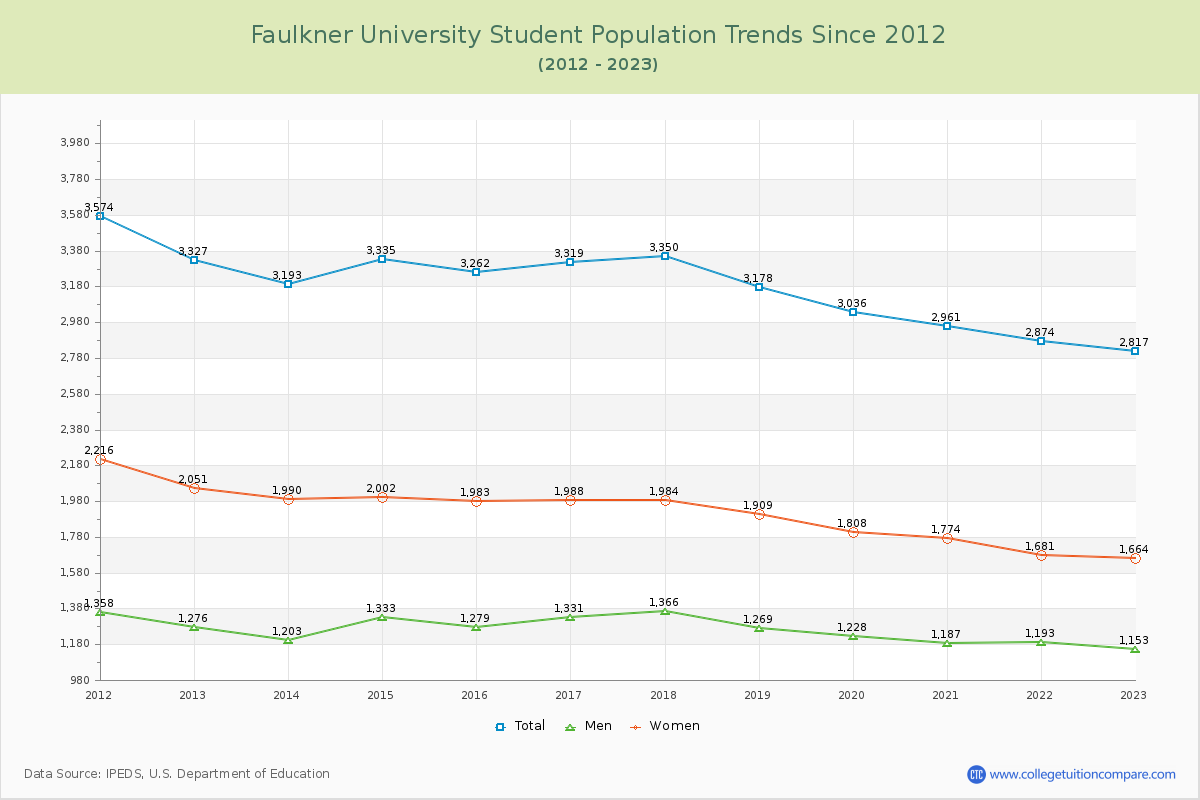
Student Population Changes
The average student population over the last 12 years is 3,150 where 2,817 students are attending the school for the academic year 2022-2023.
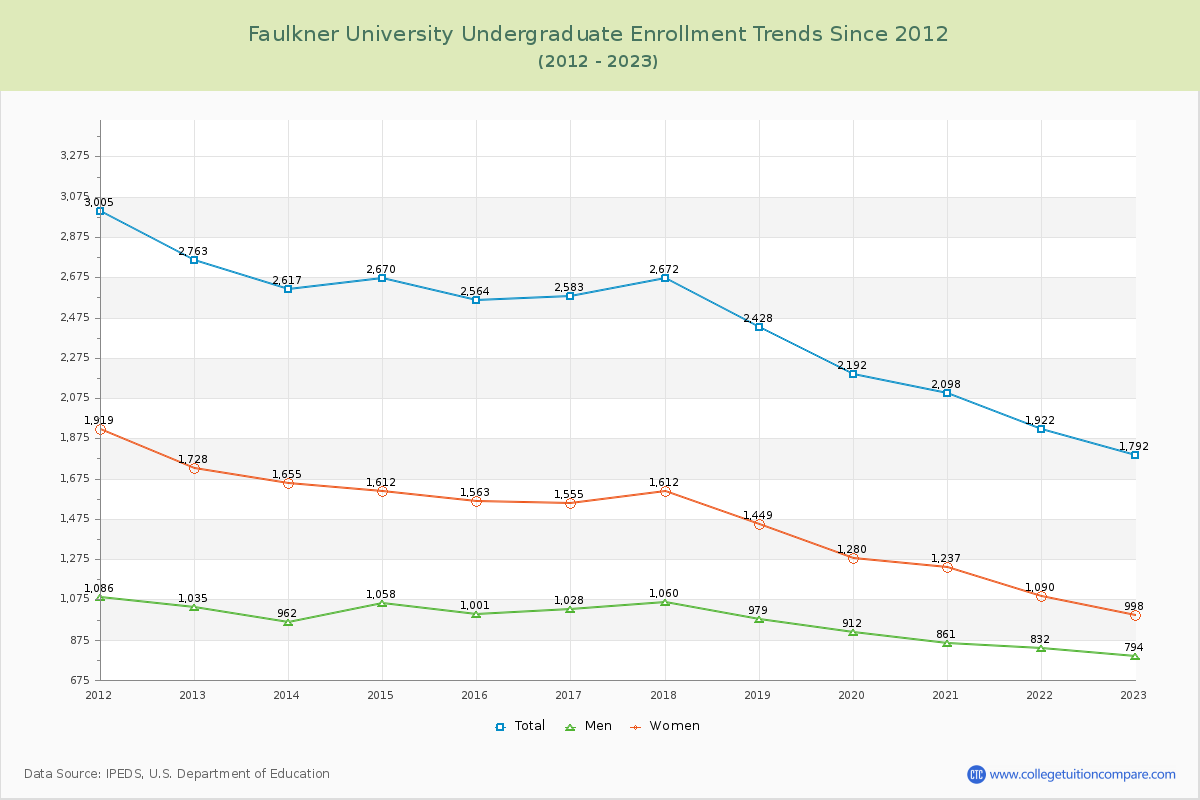
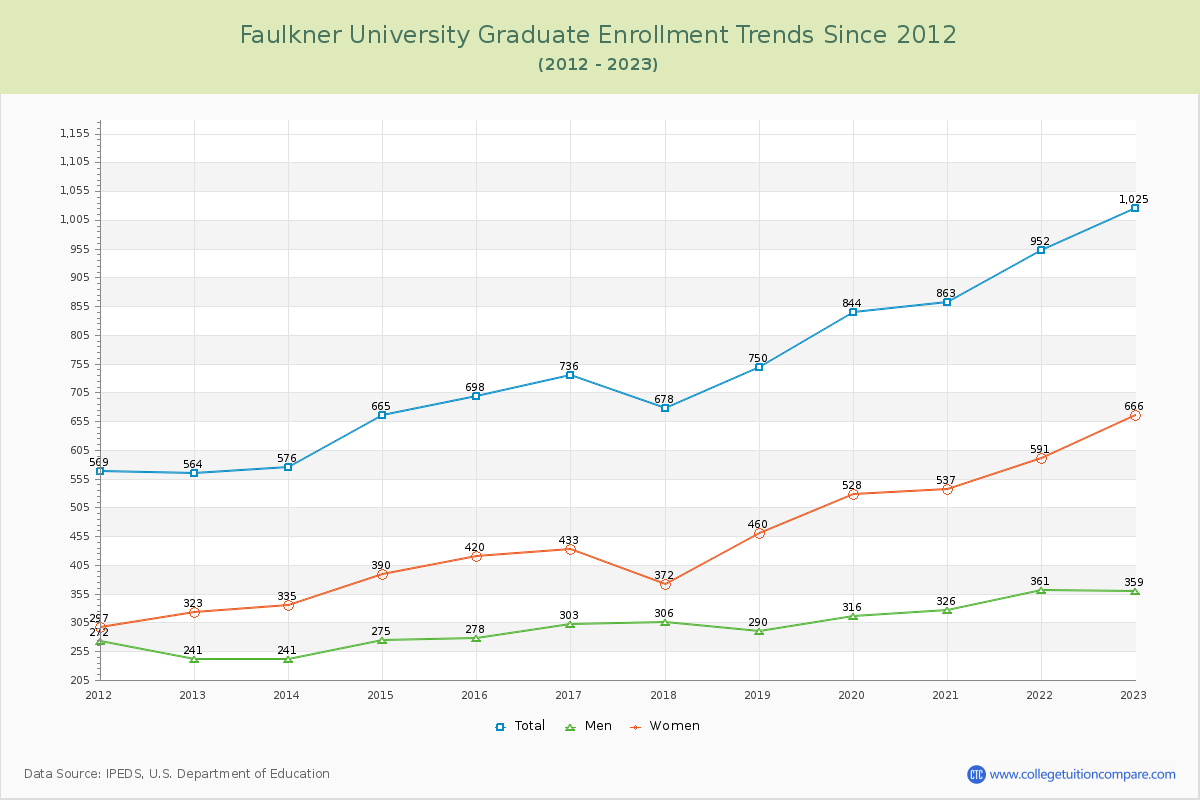
63.61% of total students is undergraduate students and 36.39% students is graduate students. The number of undergraduate students has decreased by 971 and the graduate enrollment has increased by 461 over past 10 years.
The female to male ratio is 1.44 to 1 and it means that there are more female students enrolled in Faulkner than male students.
The following table and chart illustrate the changes in student population by gender at Faulkner University since 2012.
| Year | Total | Undergraduate | Graduate | ||||
|---|---|---|---|---|---|---|---|
| Total | Men | Women | Total | Men | Women | ||
| 2012-13 | 3,327 | 2,763 | 1,035 | 1,728 | 564 | 241 | 323 |
| 2013-14 | 3,193 -134 | 2,617 -146 | 962 -73 | 1,655 -73 | 576 12 | 241 0 | 335 12 |
| 2014-15 | 3,335 142 | 2,670 53 | 1,058 96 | 1,612 -43 | 665 89 | 275 34 | 390 55 |
| 2015-16 | 3,262 -73 | 2,564 -106 | 1,001 -57 | 1,563 -49 | 698 33 | 278 3 | 420 30 |
| 2016-17 | 3,319 57 | 2,583 19 | 1,028 27 | 1,555 -8 | 736 38 | 303 25 | 433 13 |
| 2017-18 | 3,350 31 | 2,672 89 | 1,060 32 | 1,612 57 | 678 -58 | 306 3 | 372 -61 |
| 2018-19 | 3,178 -172 | 2,428 -244 | 979 -81 | 1,449 -163 | 750 72 | 290 -16 | 460 88 |
| 2019-20 | 3,036 -142 | 2,192 -236 | 912 -67 | 1,280 -169 | 844 94 | 316 26 | 528 68 |
| 2020-21 | 2,961 -75 | 2,098 -94 | 861 -51 | 1,237 -43 | 863 19 | 326 10 | 537 9 |
| 2021-22 | 2,874 -87 | 1,922 -176 | 832 -29 | 1,090 -147 | 952 89 | 361 35 | 591 54 |
| 2022-23 | 2,817 -57 | 1,792 -130 | 794 -38 | 998 -92 | 1,025 73 | 359 -2 | 666 75 |
| Average | 3,150 | 2,391 | 957 | 1,434 | 759 | 300 | 460 |