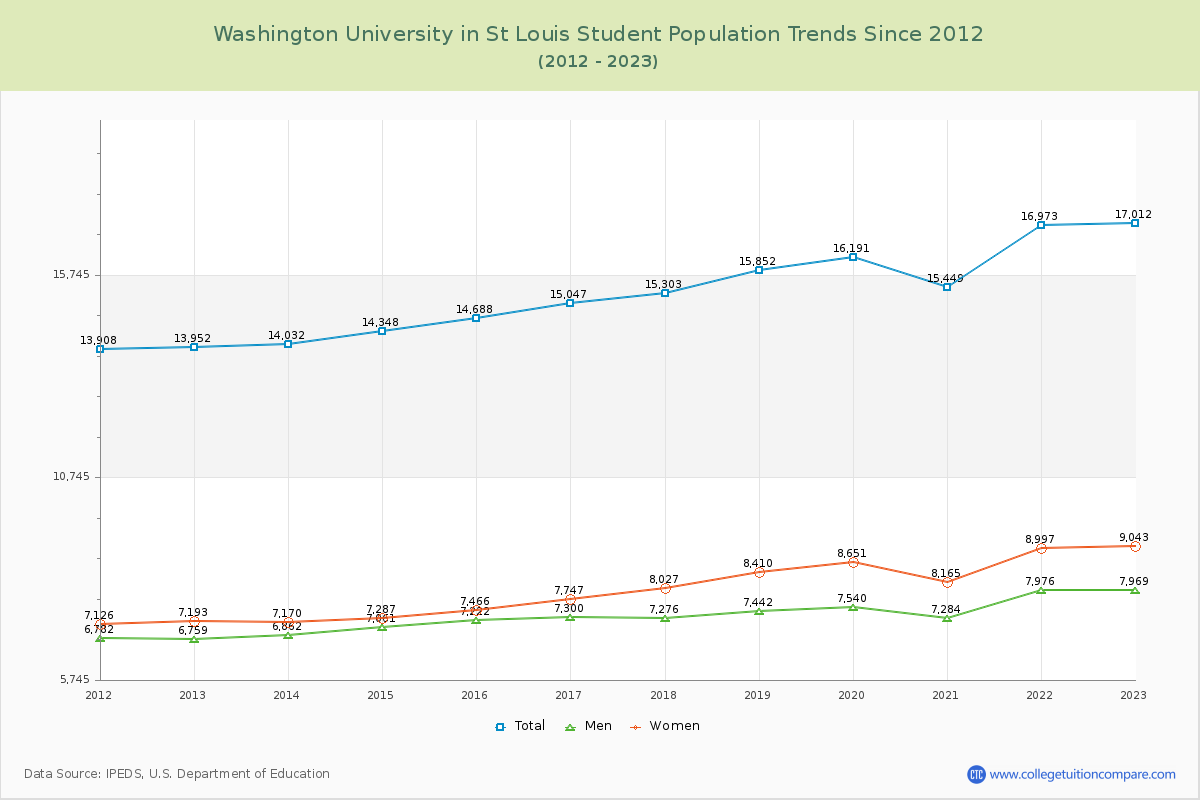
Student Population Changes
The average student population over the last 12 years is 15,350 where 17,012 students are attending the school for the academic year 2022-2023.
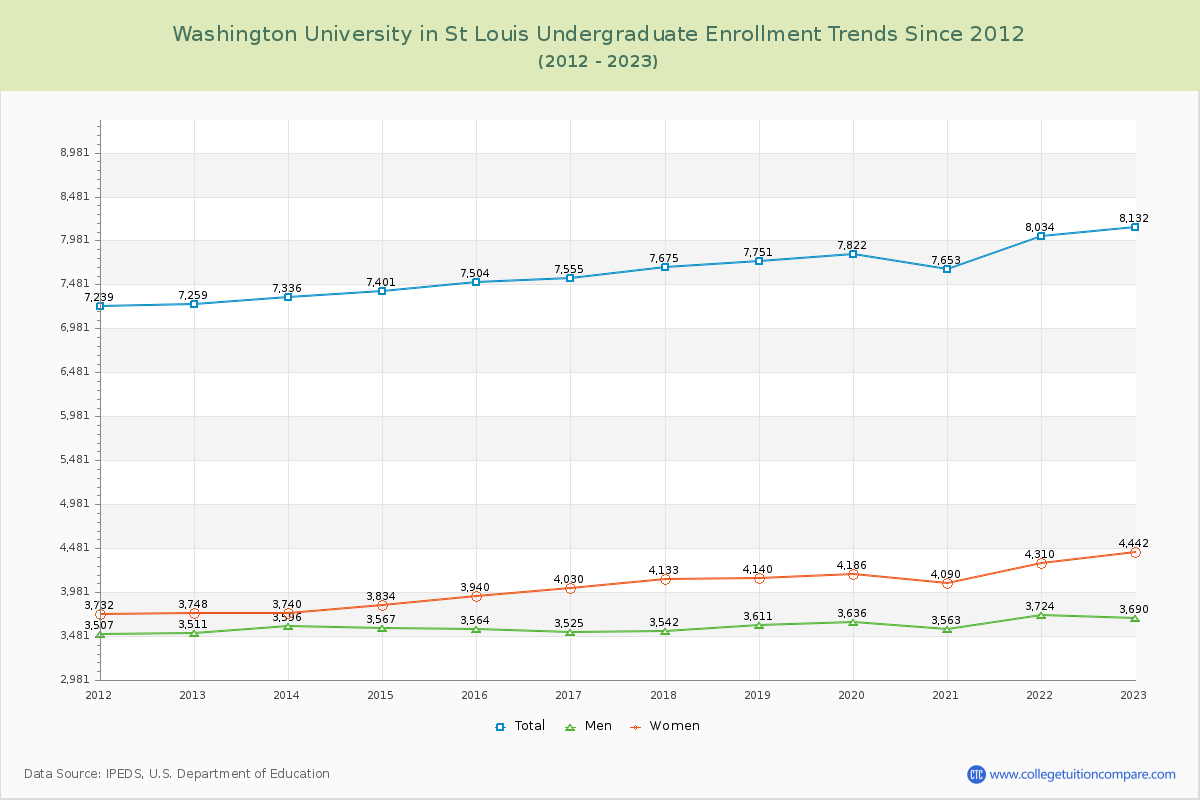
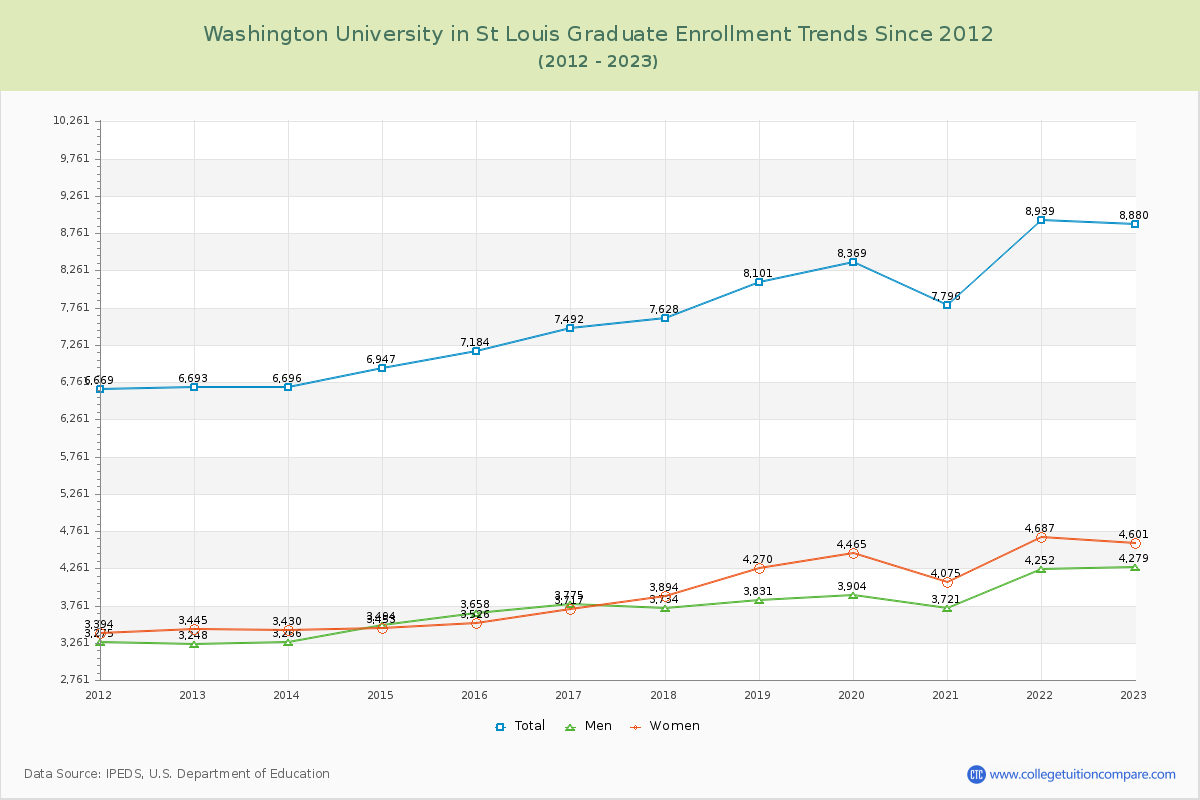
47.80% of total students is undergraduate students and 52.20% students is graduate students. The number of undergraduate students has increased by 873 and the graduate enrollment has increased by 2,187 over past 10 years.
The female to male ratio is 1.13 to 1 and it means that there are slightly more female students enrolled in WUSTL than male students.
The following table and chart illustrate the changes in student population by gender at Washington University in St Louis since 2012.
| Year | Total | Undergraduate | Graduate | ||||
|---|---|---|---|---|---|---|---|
| Total | Men | Women | Total | Men | Women | ||
| 2012-13 | 13,952 | 7,259 | 3,511 | 3,748 | 6,693 | 3,248 | 3,445 |
| 2013-14 | 14,032 80 | 7,336 77 | 3,596 85 | 3,740 -8 | 6,696 3 | 3,266 18 | 3,430 -15 |
| 2014-15 | 14,348 316 | 7,401 65 | 3,567 -29 | 3,834 94 | 6,947 251 | 3,494 228 | 3,453 23 |
| 2015-16 | 14,688 340 | 7,504 103 | 3,564 -3 | 3,940 106 | 7,184 237 | 3,658 164 | 3,526 73 |
| 2016-17 | 15,047 359 | 7,555 51 | 3,525 -39 | 4,030 90 | 7,492 308 | 3,775 117 | 3,717 191 |
| 2017-18 | 15,303 256 | 7,675 120 | 3,542 17 | 4,133 103 | 7,628 136 | 3,734 -41 | 3,894 177 |
| 2018-19 | 15,852 549 | 7,751 76 | 3,611 69 | 4,140 7 | 8,101 473 | 3,831 97 | 4,270 376 |
| 2019-20 | 16,191 339 | 7,822 71 | 3,636 25 | 4,186 46 | 8,369 268 | 3,904 73 | 4,465 195 |
| 2020-21 | 15,449 -742 | 7,653 -169 | 3,563 -73 | 4,090 -96 | 7,796 -573 | 3,721 -183 | 4,075 -390 |
| 2021-22 | 16,973 1,524 | 8,034 381 | 3,724 161 | 4,310 220 | 8,939 1,143 | 4,252 531 | 4,687 612 |
| 2022-23 | 17,012 39 | 8,132 98 | 3,690 -34 | 4,442 132 | 8,880 -59 | 4,279 27 | 4,601 -86 |
| Average | 15,350 | 7,647 | 3,594 | 4,054 | 7,702 | 3,742 | 3,960 |