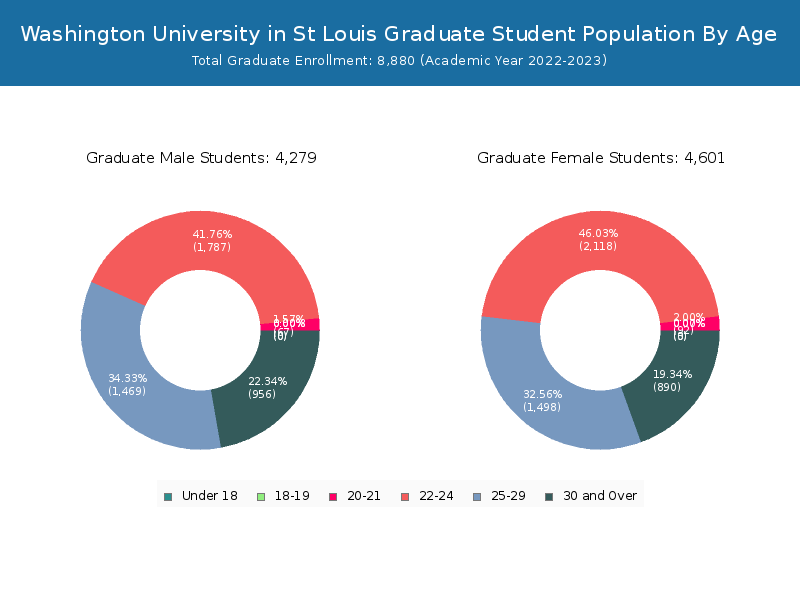
Student Population by Gender
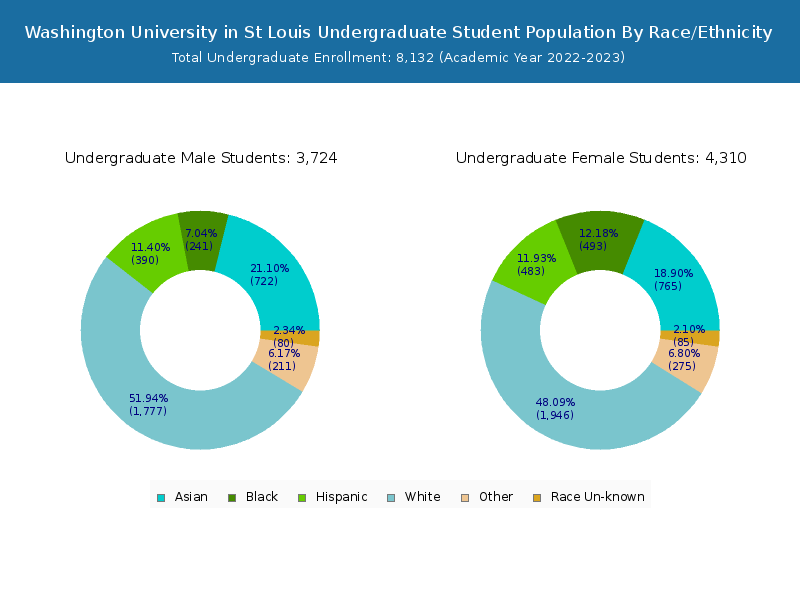
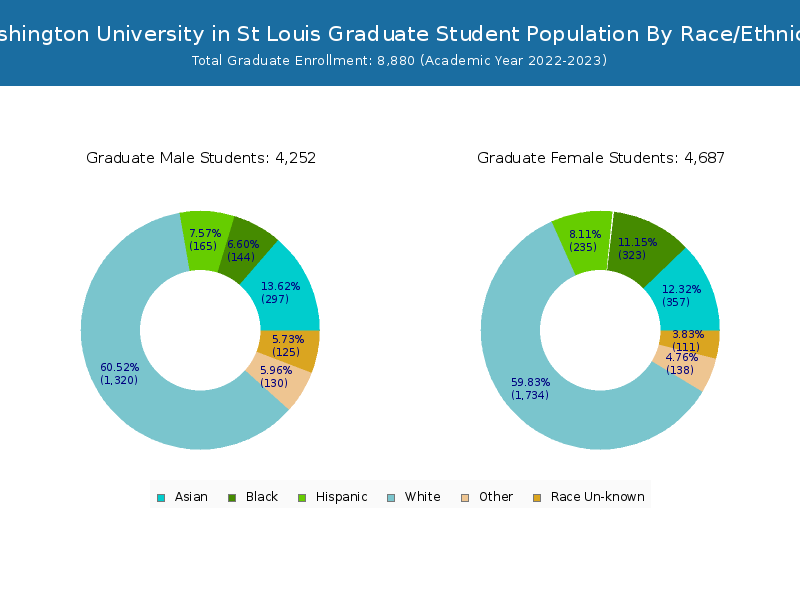
Washington University in St Louis has a total of 17,012 enrolled students for the academic year 2022-2023. 8,132 students have enrolled in undergraduate programs and 8,880 students joined graduate programs.
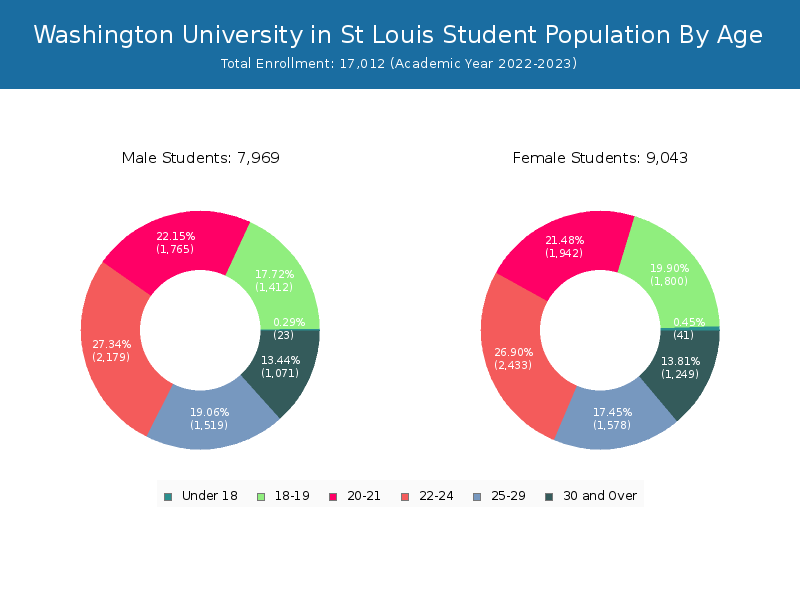
By gender, 7,969 male and 9,043 female students (the male-female ratio is 47:53) are attending the school. The gender distribution is based on the 2022-2023 data.
| Total | Undergraduate | Graduate | |
|---|---|---|---|
| Total | 17,012 | 8,132 | 8,880 |
| Men | 7,969 | 3,690 | 4,279 |
| Women | 9,043 | 4,442 | 4,601 |
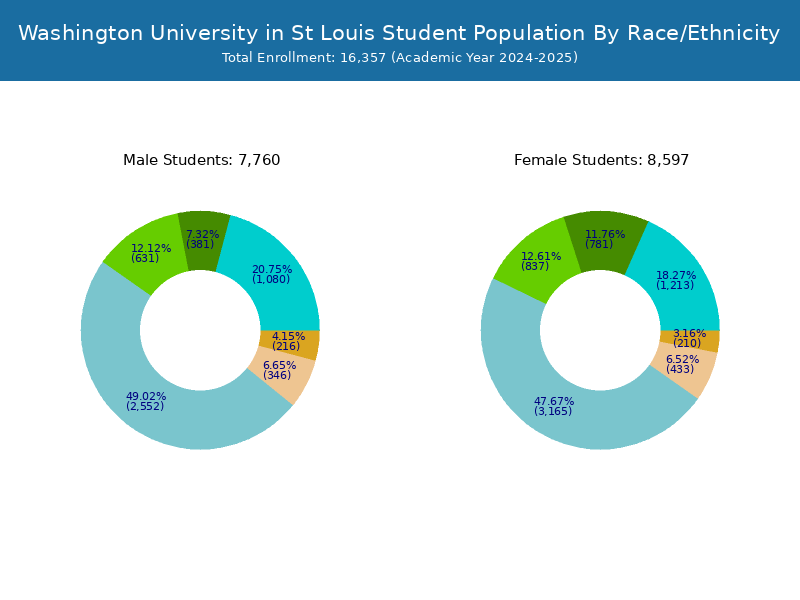
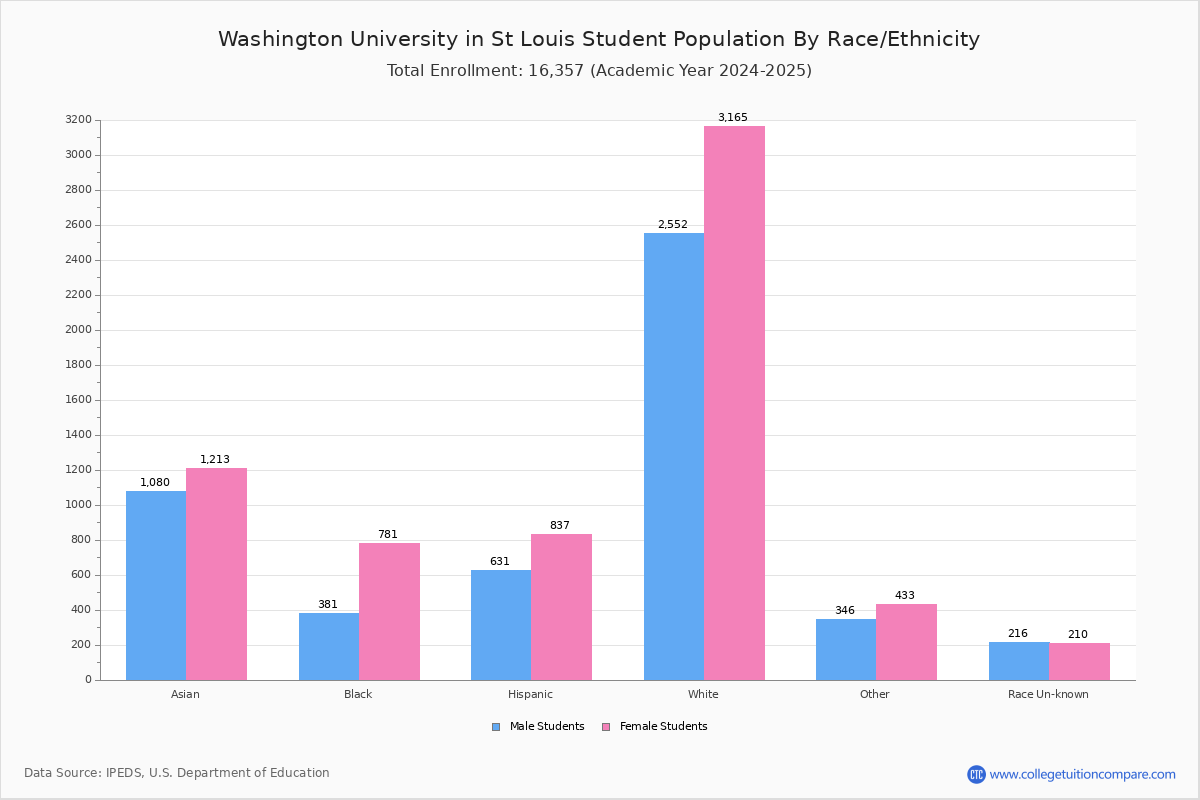
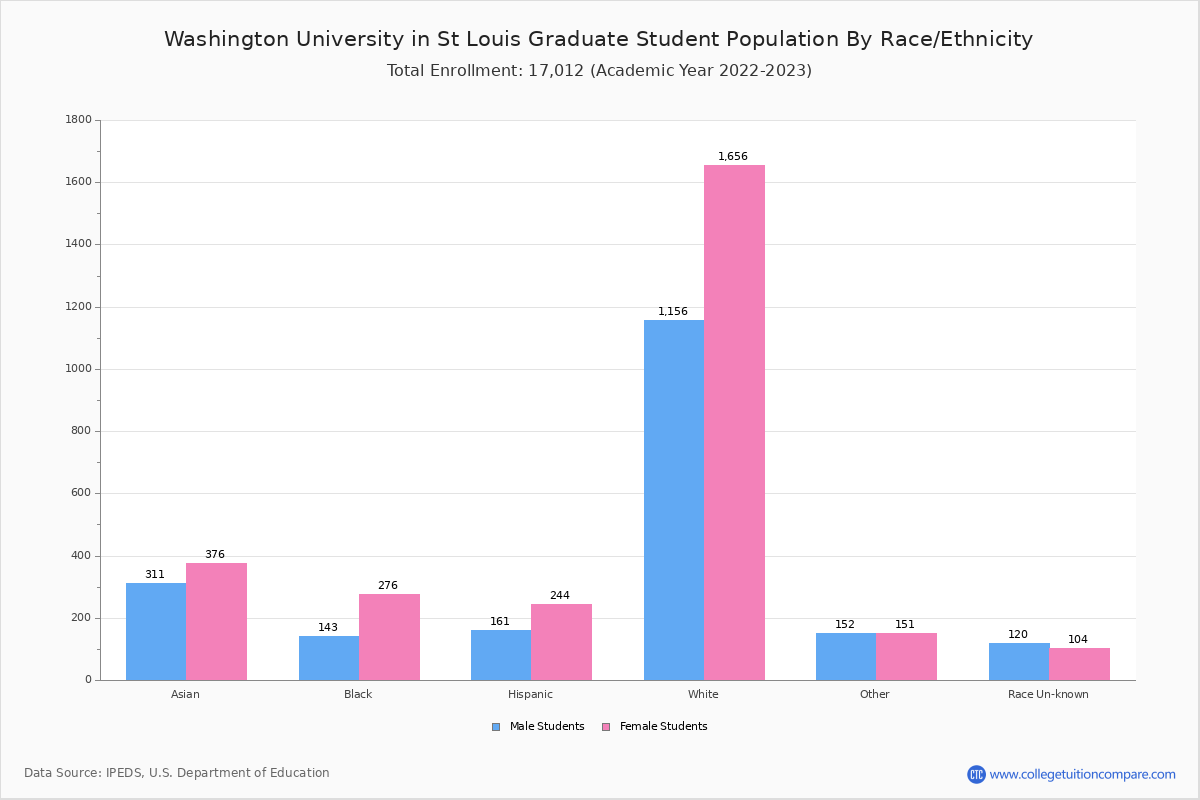
Student Distribution by Race/Ethnicity
By race/ethnicity, 6,382 White, 1,169 Black, and 2,270 Asian students out of a total of 17,012 are attending at Washington University in St Louis. Comprehensive enrollment statistic data by race/ethnicity is shown in the next chart (Academic year 2022-2023 data).

| Race | Total | Men | Women |
|---|---|---|---|
| American Indian or Native American | 32 | 10 | 22 |
| Asian | 2,270 | 1,059 | 1,211 |
| Black | 1,169 | 384 | 785 |
| Hispanic | 1,345 | 567 | 778 |
| Native Hawaiian or Other Pacific Islanders | 14 | 6 | 8 |
| White | 6,382 | 2,826 | 3,556 |
| Two or more races | 766 | 350 | 416 |
| Race Unknown | 365 | 178 | 187 |
| Race | Total | Men | Women |
|---|---|---|---|
| American Indian or Native American | 9 | 4 | 5 |
| Asian | 1,583 | 748 | 835 |
| Black | 750 | 241 | 509 |
| Hispanic | 940 | 406 | 534 |
| Native Hawaiian or Other Pacific Islanders | 8 | 4 | 4 |
| White | 3,570 | 1,670 | 1,900 |
| Two or more races | 492 | 206 | 286 |
| Race Unknown | 141 | 58 | 83 |
| Race | Total | Men | Women |
|---|---|---|---|
| American Indian or Native American | 0 | 0 | 0 |
| Asian | 18 | 11 | 7 |
| Black | 23 | 7 | 16 |
| Hispanic | 19 | 7 | 12 |
| Native Hawaiian or Other Pacific Islanders | 0 | 0 | 0 |
| White | 81 | 39 | 42 |
| Two or more races | 8 | 3 | 5 |
| Race Unknown | 8 | 2 | 6 |
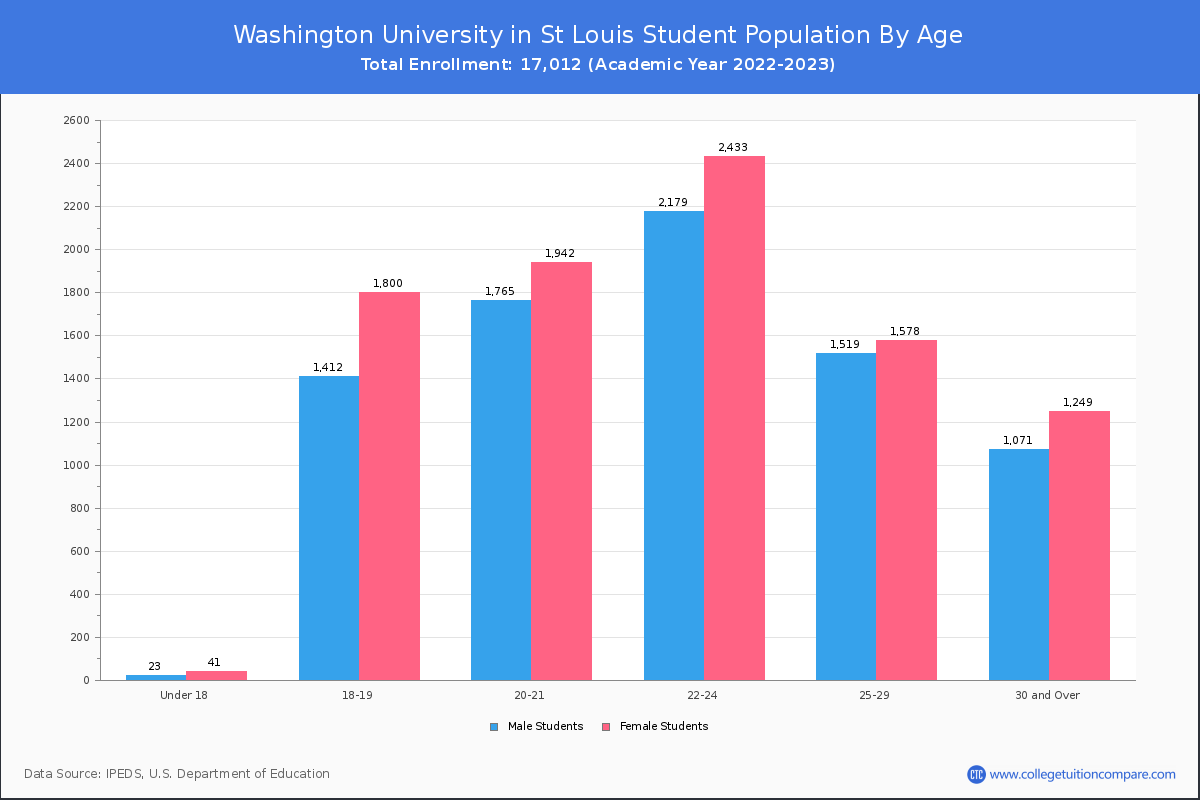
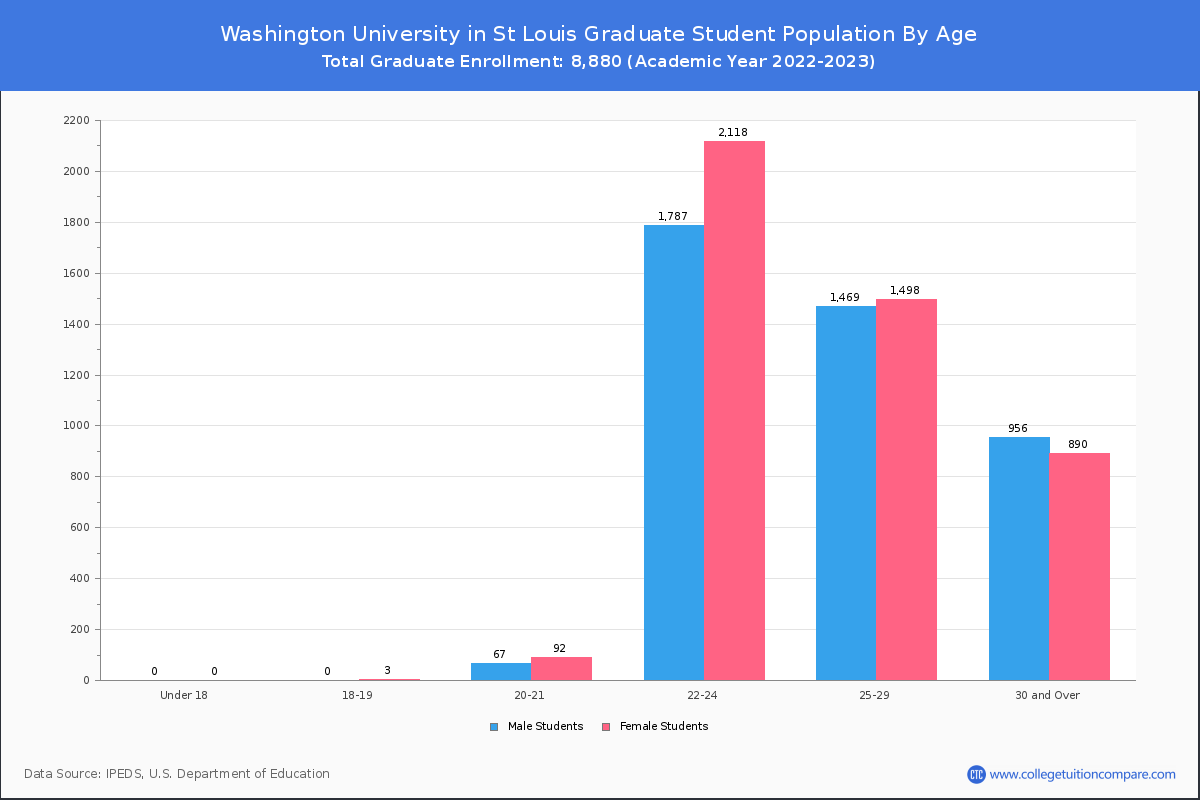
Student Age Distribution
By age, WUSTL has 64 students under 18 years old and 23 students over 65 years old. There are 11,595 students under 25 years old, and 5,417 students over 25 years old out of 17,012 total students.
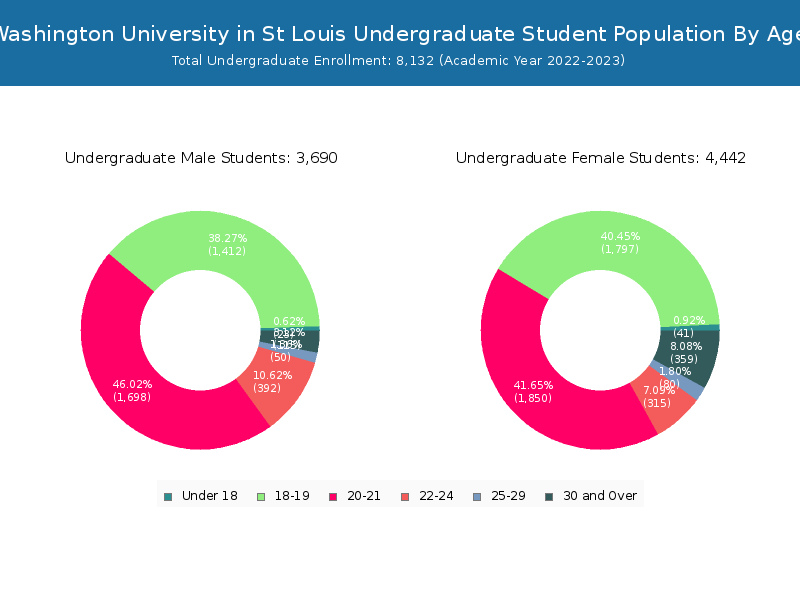
In undergraduate programs, 64 students are younger than 18 and 12 students are older than 65. WUSTL has 7,528 undergraduate students aged under 25 and 604 students aged 25 and over.
It has 4,067 graduate students aged under 25 and 4,813 students aged 25 and over.

| Age | Total | Men | Women |
|---|---|---|---|
| Under 18 | 64 | 41 | 23 |
| 18-19 | 3,212 | 1,800 | 1,412 |
| 20-21 | 3,707 | 1,942 | 1,765 |
| 22-24 | 4,612 | 2,433 | 2,179 |
| 25-29 | 3,097 | 1,578 | 1,519 |
| 30-34 | 1,104 | 559 | 545 |
| 35-39 | 478 | 268 | 210 |
| 40-49 | 523 | 293 | 230 |
| 50-64 | 192 | 113 | 79 |
| Over 65 | 23 | 16 | 7 |
| Age | Total | Men | Women |
|---|---|---|---|
| Under 18 | 64 | 41 | 23 |
| 18-19 | 3,209 | 1,797 | 1,412 |
| 20-21 | 3,548 | 1,850 | 1,698 |
| 22-24 | 707 | 315 | 392 |
| 25-29 | 130 | 80 | 50 |
| 30-34 | 126 | 93 | 33 |
| 35-39 | 103 | 85 | 18 |
| 40-49 | 159 | 119 | 40 |
| 50-64 | 74 | 54 | 20 |
| Over 65 | 12 | 8 | 4 |
| Age | Total | Men | Women |
|---|
Online Student Enrollment
Distance learning, also called online education, is very attractive to students, especially who want to continue education and work in field. At Washington University in St Louis, 780 students are enrolled exclusively in online courses and 1,277 students are enrolled in some online courses.
384 students lived in Missouri or jurisdiction in which the school is located are enrolled exclusively in online courses and 396 students live in other State or outside of the United States.

| All Students | Enrolled Exclusively Online Courses | Enrolled in Some Online Courses | |
|---|---|---|---|
| All Students | 17,012 | 780 | 1,277 |
| Undergraduate | 8,132 | 350 | 467 |
| Graduate | 8,880 | 430 | 810 |
| Missouri Residents | Other States in U.S. | Outside of U.S. | |
|---|---|---|---|
| All Students | 384 | 342 | 54 |
| Undergraduate | 259 | 87 | 4 |
| Graduate | 125 | 255 | 50 |
Transfer-in Students (Undergraduate)
Among 8,132 enrolled in undergraduate programs, 194 students have transferred-in from other institutions. The percentage of transfer-in students is 2.39%.127 students have transferred in as full-time status and 67 students transferred in as part-time status.
| Number of Students | |
|---|---|
| Regular Full-time | 7,318 |
| Transfer-in Full-time | 127 |
| Regular Part-time | 620 |
| Transfer-in Part-time | 67 |