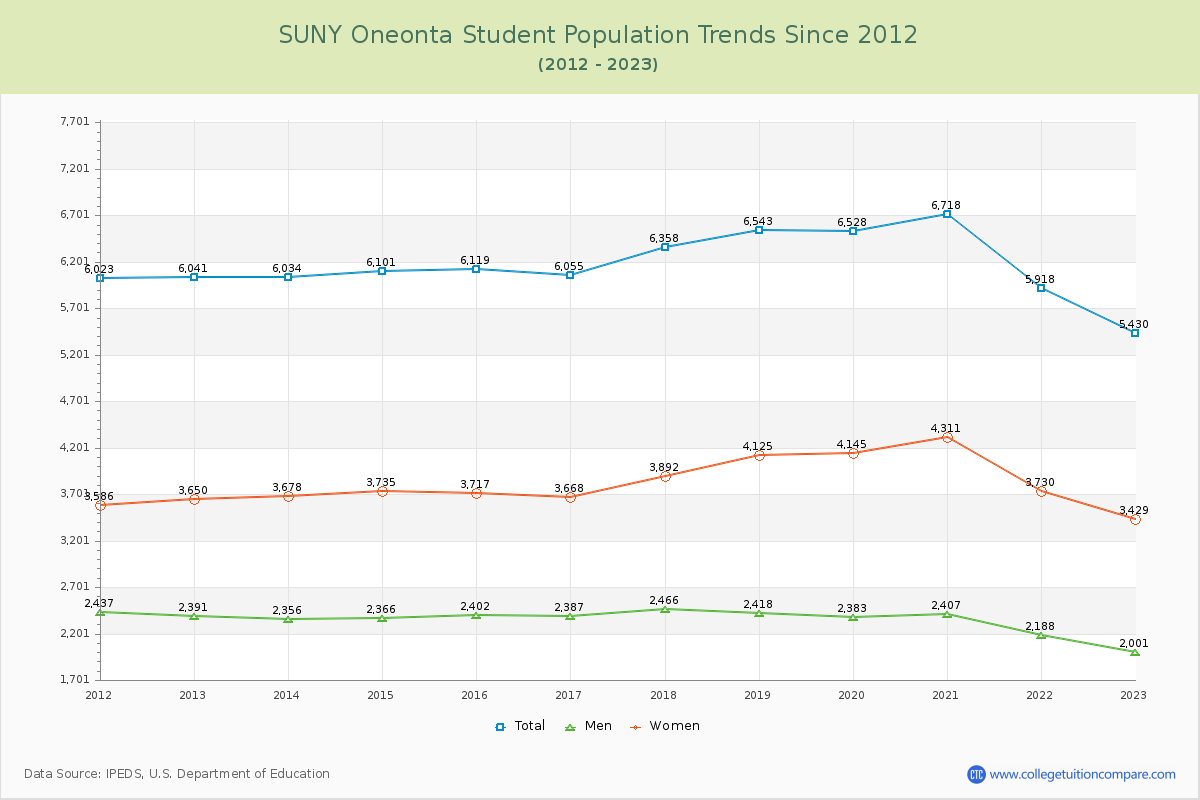
Student Population Changes
The average student population over the last 12 years is 6,168 where 5,430 students are attending the school for the academic year 2022-2023.
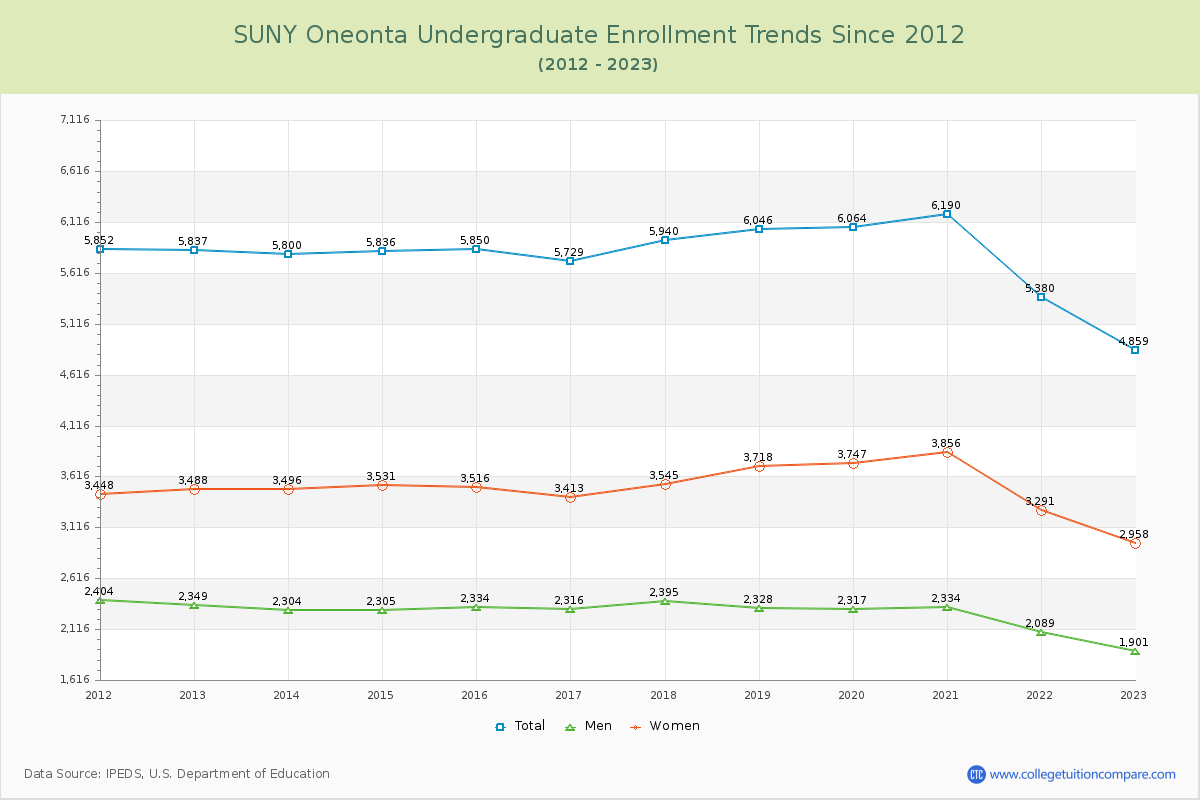
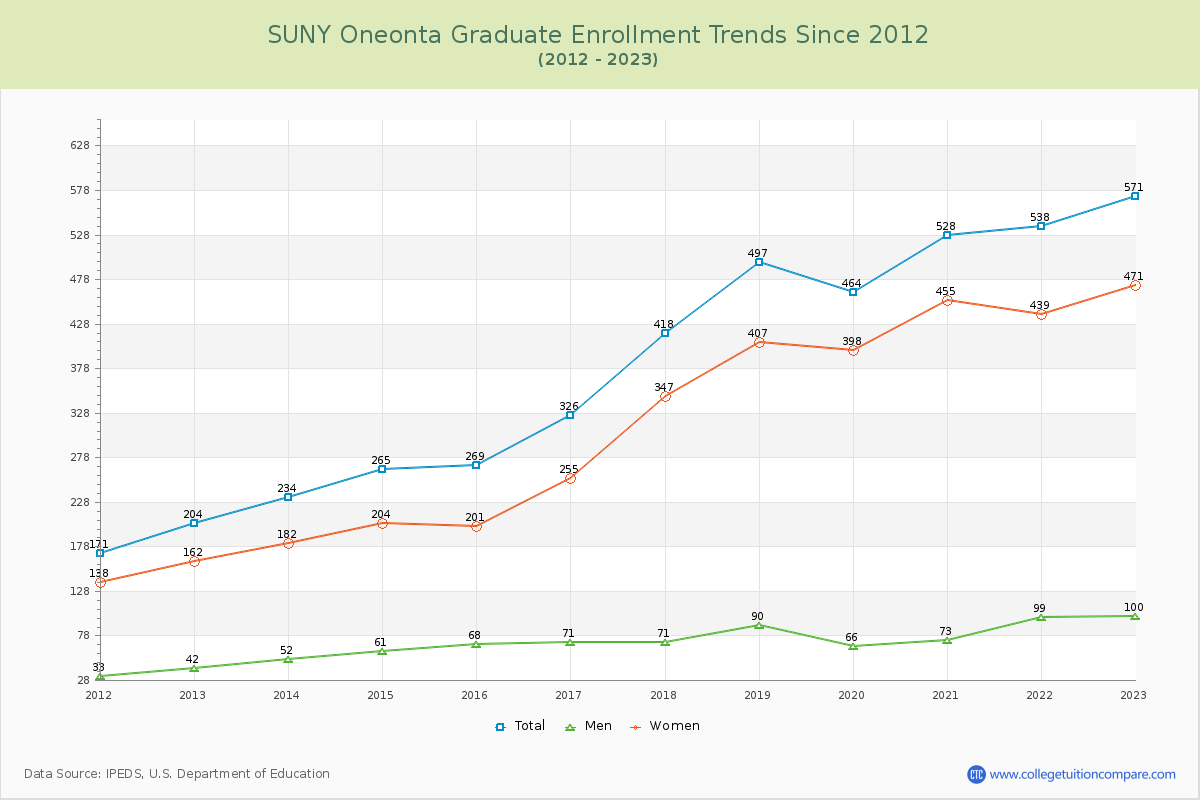
89.48% of total students is undergraduate students and 10.52% students is graduate students. The number of undergraduate students has decreased by 978 and the graduate enrollment has increased by 367 over past 10 years.
The female to male ratio is 1.71 to 1 and it means that there are more female students enrolled in SUNY Oneonta than male students.
The following table and chart illustrate the changes in student population by gender at SUNY Oneonta since 2012.
| Year | Total | Undergraduate | Graduate | ||||
|---|---|---|---|---|---|---|---|
| Total | Men | Women | Total | Men | Women | ||
| 2012-13 | 6,041 | 5,837 | 2,349 | 3,488 | 204 | 42 | 162 |
| 2013-14 | 6,034 -7 | 5,800 -37 | 2,304 -45 | 3,496 8 | 234 30 | 52 10 | 182 20 |
| 2014-15 | 6,101 67 | 5,836 36 | 2,305 1 | 3,531 35 | 265 31 | 61 9 | 204 22 |
| 2015-16 | 6,119 18 | 5,850 14 | 2,334 29 | 3,516 -15 | 269 4 | 68 7 | 201 -3 |
| 2016-17 | 6,055 -64 | 5,729 -121 | 2,316 -18 | 3,413 -103 | 326 57 | 71 3 | 255 54 |
| 2017-18 | 6,358 303 | 5,940 211 | 2,395 79 | 3,545 132 | 418 92 | 71 0 | 347 92 |
| 2018-19 | 6,543 185 | 6,046 106 | 2,328 -67 | 3,718 173 | 497 79 | 90 19 | 407 60 |
| 2019-20 | 6,528 -15 | 6,064 18 | 2,317 -11 | 3,747 29 | 464 -33 | 66 -24 | 398 -9 |
| 2020-21 | 6,718 190 | 6,190 126 | 2,334 17 | 3,856 109 | 528 64 | 73 7 | 455 57 |
| 2021-22 | 5,918 -800 | 5,380 -810 | 2,089 -245 | 3,291 -565 | 538 10 | 99 26 | 439 -16 |
| 2022-23 | 5,430 -488 | 4,859 -521 | 1,901 -188 | 2,958 -333 | 571 33 | 100 1 | 471 32 |
| Average | 6,168 | 5,776 | 2,270 | 3,505 | 392 | 72 | 320 |