Student Population by Gender
SUNY Oneonta has a total of 5,430 enrolled students for the academic year 2022-2023. 4,859 students have enrolled in undergraduate programs and 571 students joined graduate programs.
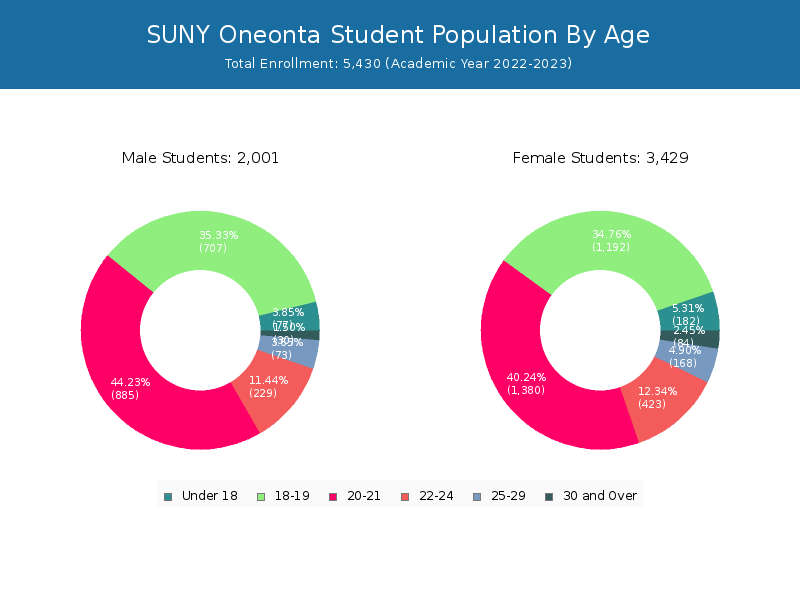
By gender, 2,001 male and 3,429 female students (the male-female ratio is 37:63) are attending the school. The gender distribution is based on the 2022-2023 data.
| Total | Undergraduate | Graduate | |
|---|---|---|---|
| Total | 5,430 | 4,859 | 571 |
| Men | 2,001 | 1,901 | 100 |
| Women | 3,429 | 2,958 | 471 |
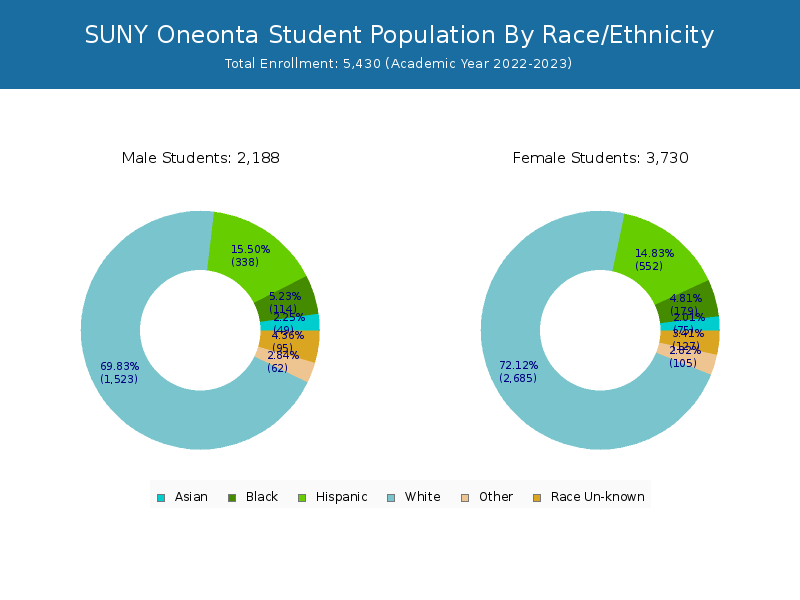
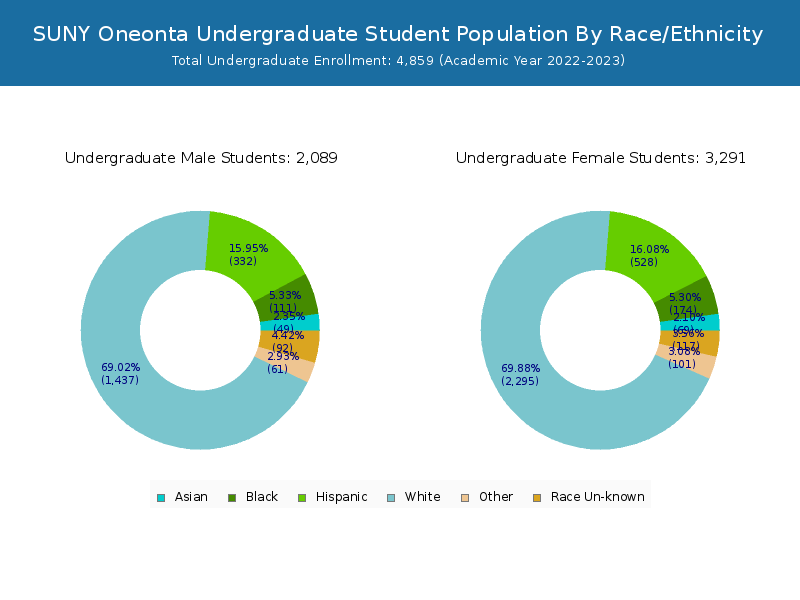
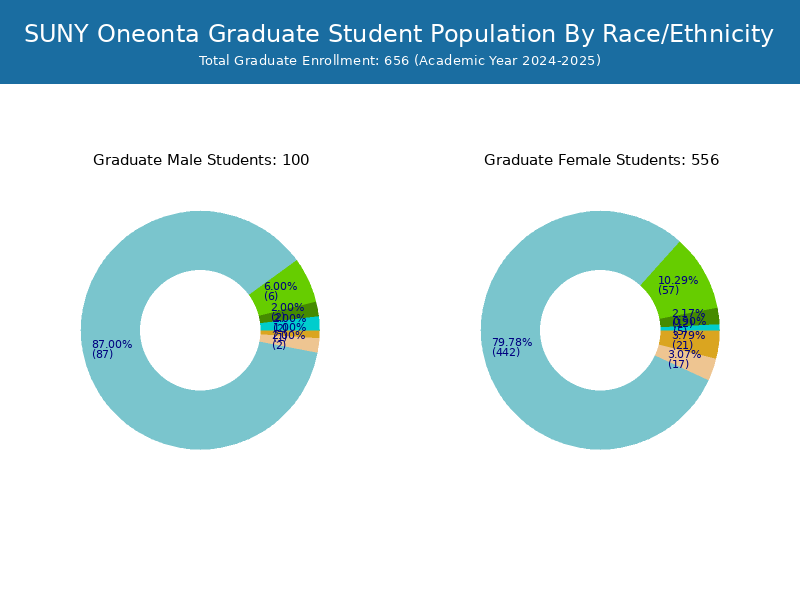
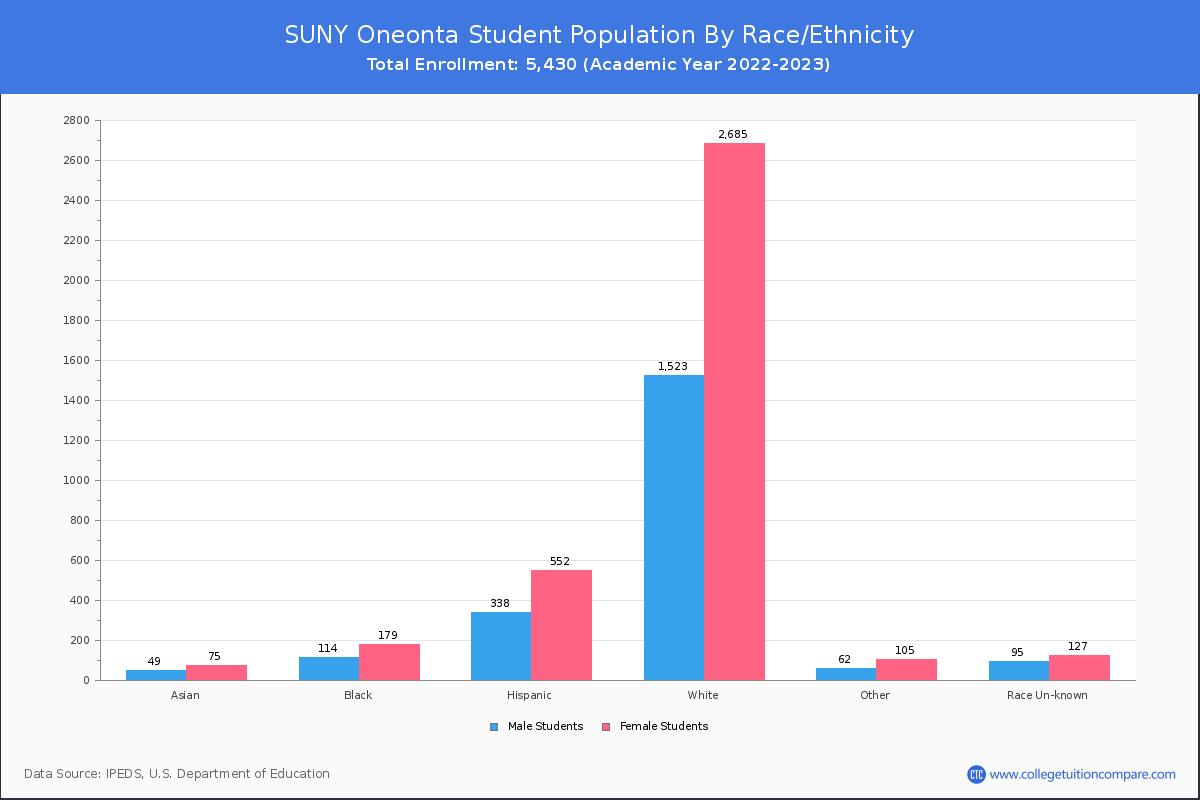
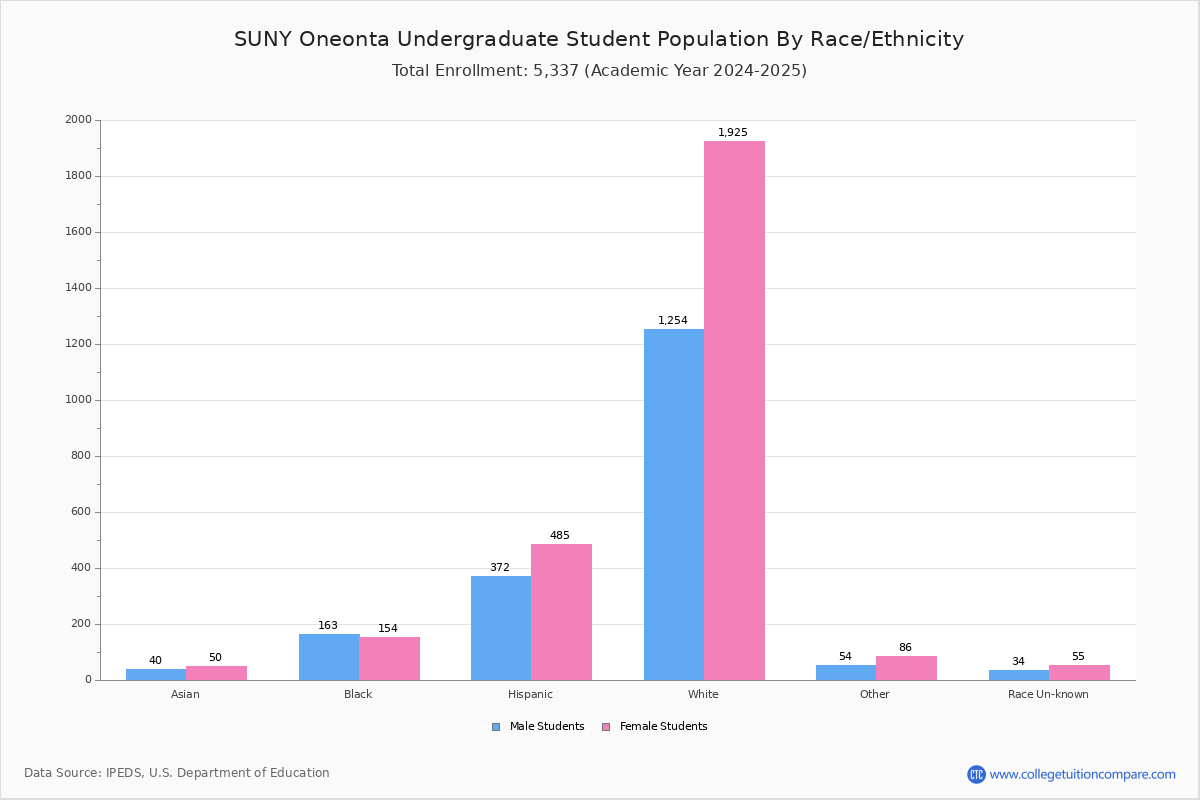
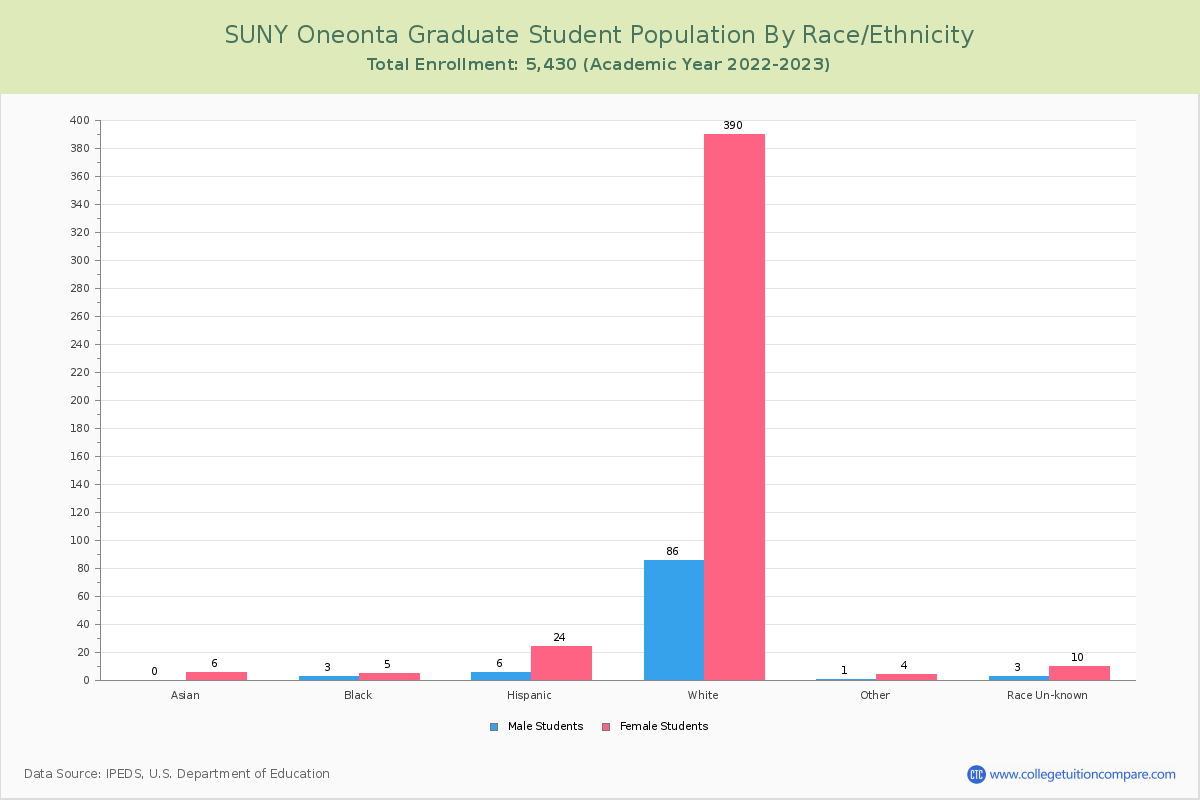
Student Distribution by Race/Ethnicity
By race/ethnicity, 3,878 White, 252 Black, and 102 Asian students out of a total of 5,430 are attending at SUNY Oneonta. Comprehensive enrollment statistic data by race/ethnicity is shown in the next chart (Academic year 2022-2023 data).
| Race | Total | Men | Women |
|---|---|---|---|
| American Indian or Native American | 24 | 9 | 15 |
| Asian | 102 | 49 | 53 |
| Black | 252 | 102 | 150 |
| Hispanic | 869 | 324 | 545 |
| Native Hawaiian or Other Pacific Islanders | 2 | 1 | 1 |
| White | 3,878 | 1,396 | 2,482 |
| Two or more races | 109 | 30 | 79 |
| Race Unknown | 183 | 85 | 98 |
| Race | Total | Men | Women |
|---|---|---|---|
| American Indian or Native American | 23 | 9 | 14 |
| Asian | 95 | 48 | 47 |
| Black | 244 | 102 | 142 |
| Hispanic | 833 | 318 | 515 |
| Native Hawaiian or Other Pacific Islanders | 2 | 1 | 1 |
| White | 3,385 | 1,307 | 2,078 |
| Two or more races | 98 | 29 | 69 |
| Race Unknown | 169 | 82 | 87 |
| Race | Total | Men | Women |
|---|---|---|---|
| American Indian or Native American | 1 | 0 | 1 |
| Asian | 9 | 3 | 6 |
| Black | 16 | 8 | 8 |
| Hispanic | 32 | 17 | 15 |
| Native Hawaiian or Other Pacific Islanders | 0 | 0 | 0 |
| White | 215 | 108 | 107 |
| Two or more races | 5 | 0 | 5 |
| Race Unknown | 7 | 4 | 3 |
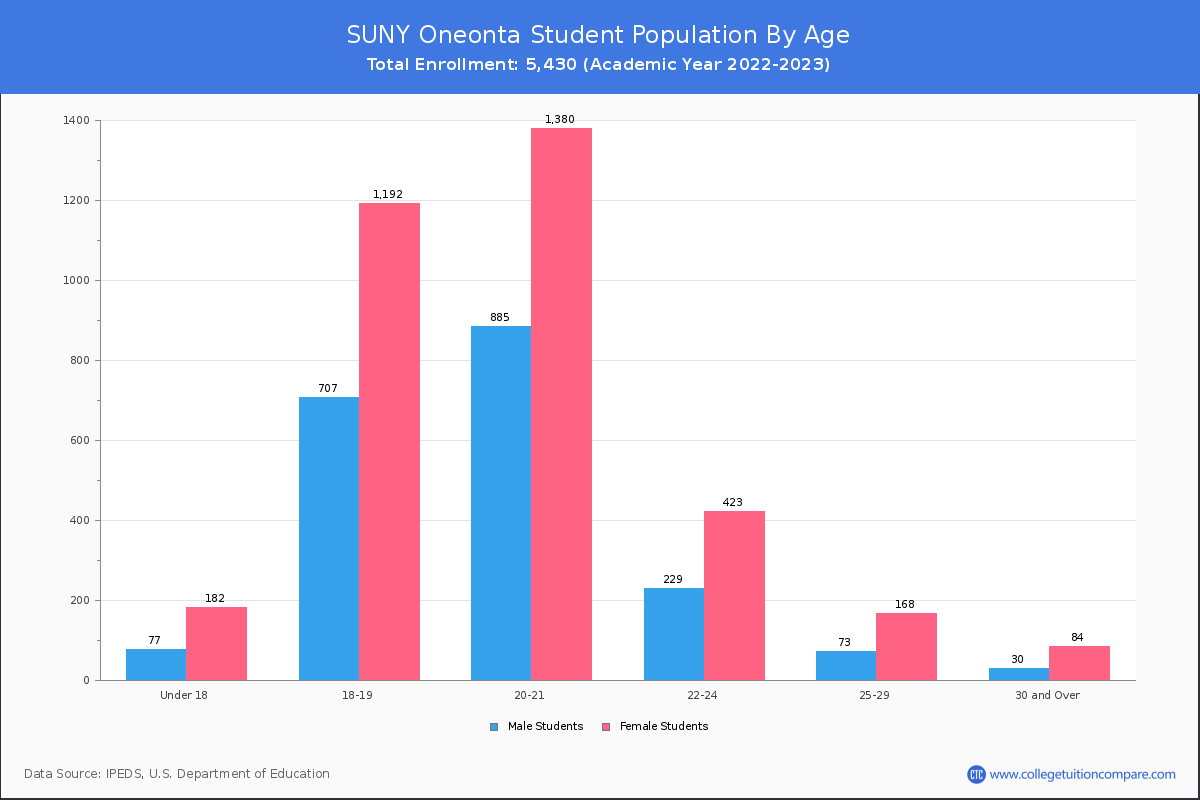
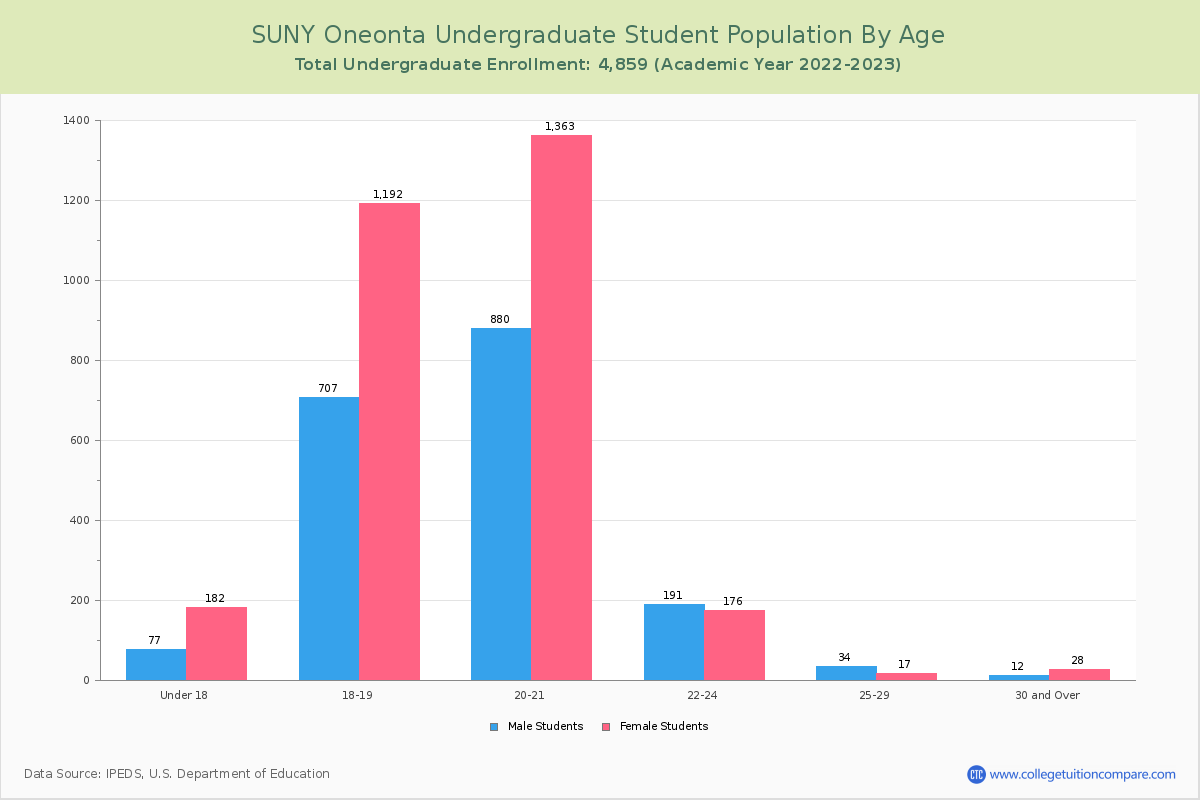
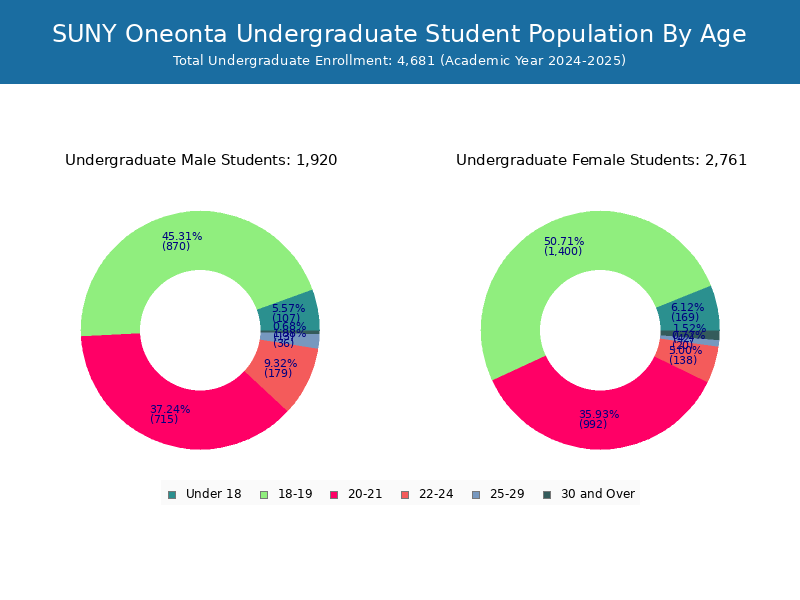
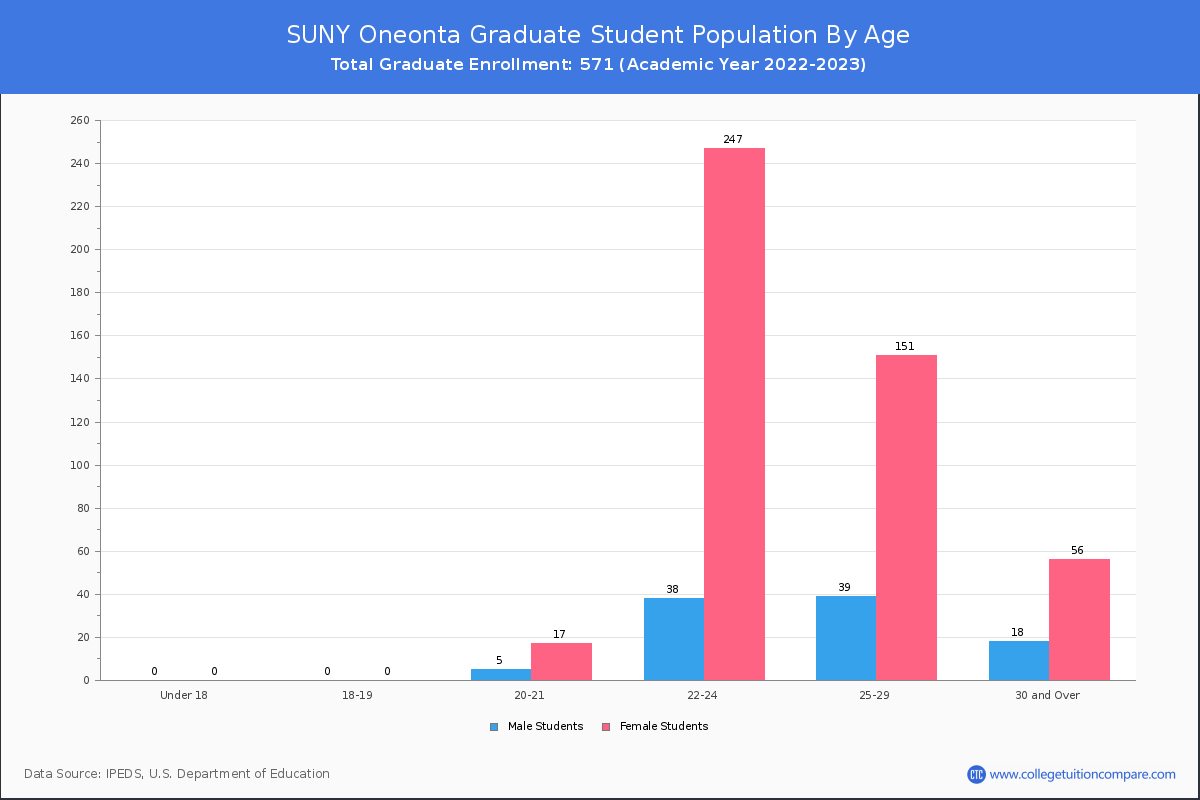
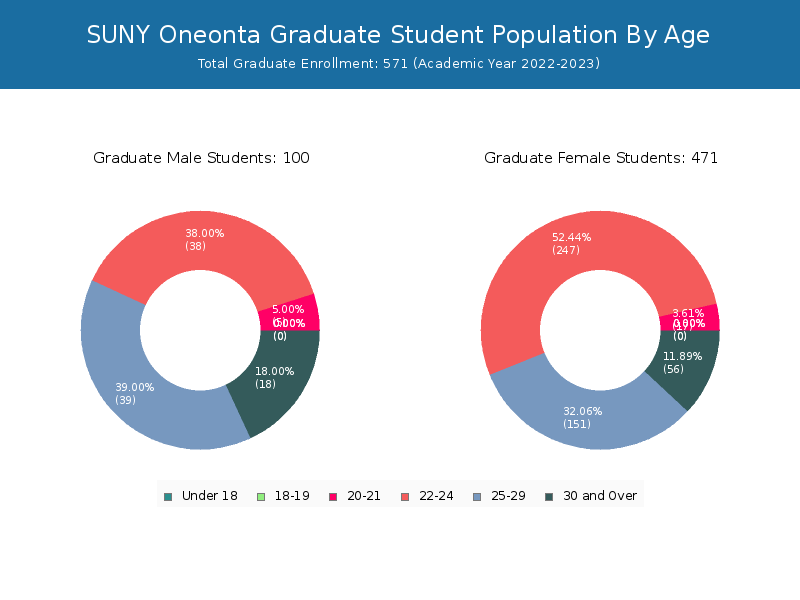
Student Age Distribution
By age, SUNY Oneonta has 259 students under 18 years old and 2 students over 65 years old. There are 5,075 students under 25 years old, and 355 students over 25 years old out of 5,430 total students.
In undergraduate programs, 259 students are younger than 18 and 1 students are older than 65. SUNY Oneonta has 4,768 undergraduate students aged under 25 and 91 students aged 25 and over.
It has 307 graduate students aged under 25 and 264 students aged 25 and over.
| Age | Total | Men | Women |
|---|---|---|---|
| Under 18 | 259 | 182 | 77 |
| 18-19 | 1,899 | 1,192 | 707 |
| 20-21 | 2,265 | 1,380 | 885 |
| 22-24 | 652 | 423 | 229 |
| 25-29 | 241 | 168 | 73 |
| 30-34 | 62 | 46 | 16 |
| 35-39 | 18 | 12 | 6 |
| 40-49 | 26 | 20 | 6 |
| 50-64 | 6 | 5 | 1 |
| Over 65 | 2 | 1 | 1 |
| Age | Total | Men | Women |
|---|---|---|---|
| Under 18 | 259 | 182 | 77 |
| 18-19 | 1,899 | 1,192 | 707 |
| 20-21 | 2,243 | 1,363 | 880 |
| 22-24 | 367 | 176 | 191 |
| 25-29 | 51 | 17 | 34 |
| 30-34 | 19 | 14 | 5 |
| 35-39 | 9 | 6 | 3 |
| 40-49 | 8 | 6 | 2 |
| 50-64 | 3 | 2 | 1 |
| Over 65 | 1 | 0 | 1 |
| Age | Total | Men | Women |
|---|
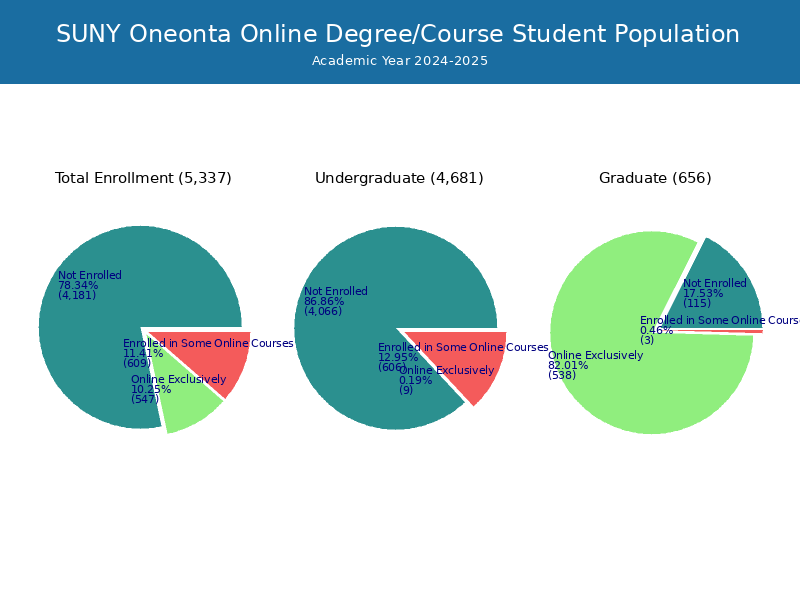
Online Student Enrollment
Distance learning, also called online education, is very attractive to students, especially who want to continue education and work in field. At SUNY Oneonta, 499 students are enrolled exclusively in online courses and 681 students are enrolled in some online courses.
492 students lived in New York or jurisdiction in which the school is located are enrolled exclusively in online courses and 7 students live in other State or outside of the United States.
| All Students | Enrolled Exclusively Online Courses | Enrolled in Some Online Courses | |
|---|---|---|---|
| All Students | 5,430 | 499 | 681 |
| Undergraduate | 4,859 | 23 | 669 |
| Graduate | 571 | 476 | 12 |
| New York Residents | Other States in U.S. | Outside of U.S. | |
|---|---|---|---|
| All Students | 492 | 7 | 0 |
| Undergraduate | 22 | 1 | 0 |
| Graduate | 470 | 6 | 0 |
Transfer-in Students (Undergraduate)
Among 4,859 enrolled in undergraduate programs, 286 students have transferred-in from other institutions. The percentage of transfer-in students is 5.89%.285 students have transferred in as full-time status and 1 students transferred in as part-time status.
| Number of Students | |
|---|---|
| Regular Full-time | 4,482 |
| Transfer-in Full-time | 285 |
| Regular Part-time | 91 |
| Transfer-in Part-time | 1 |