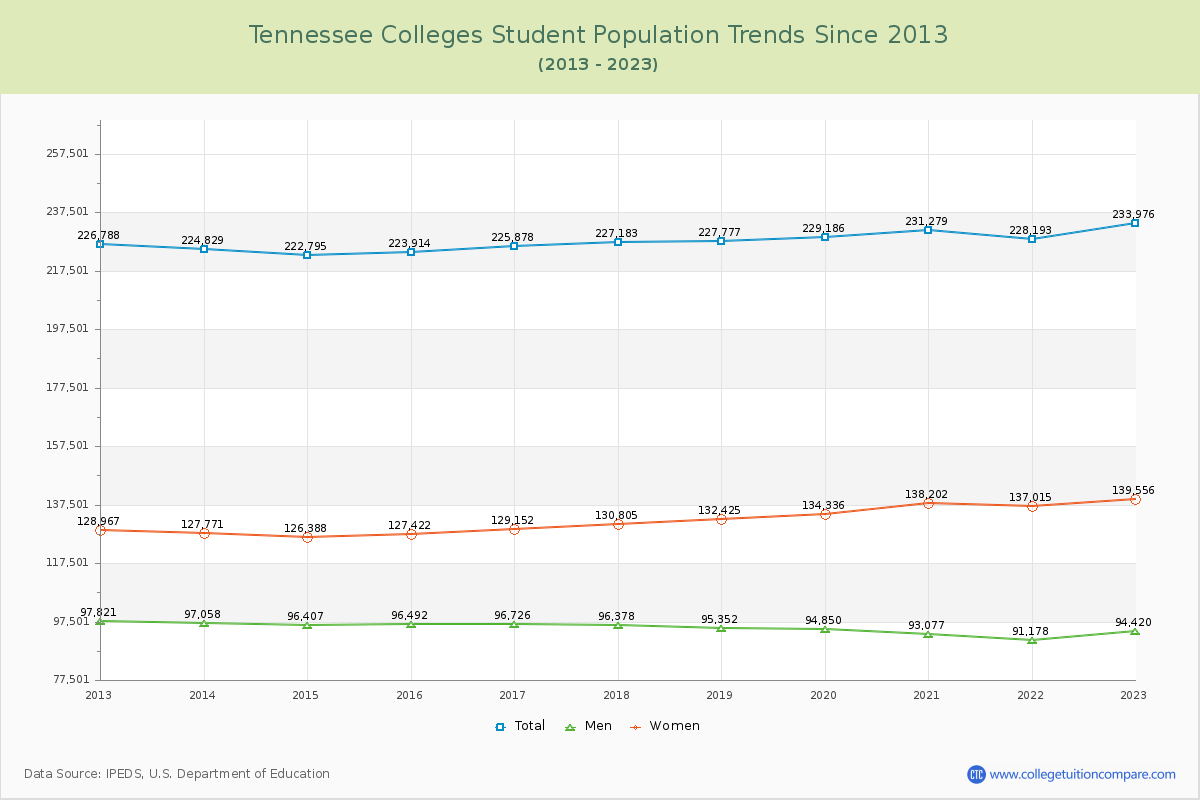
Student Population Changes
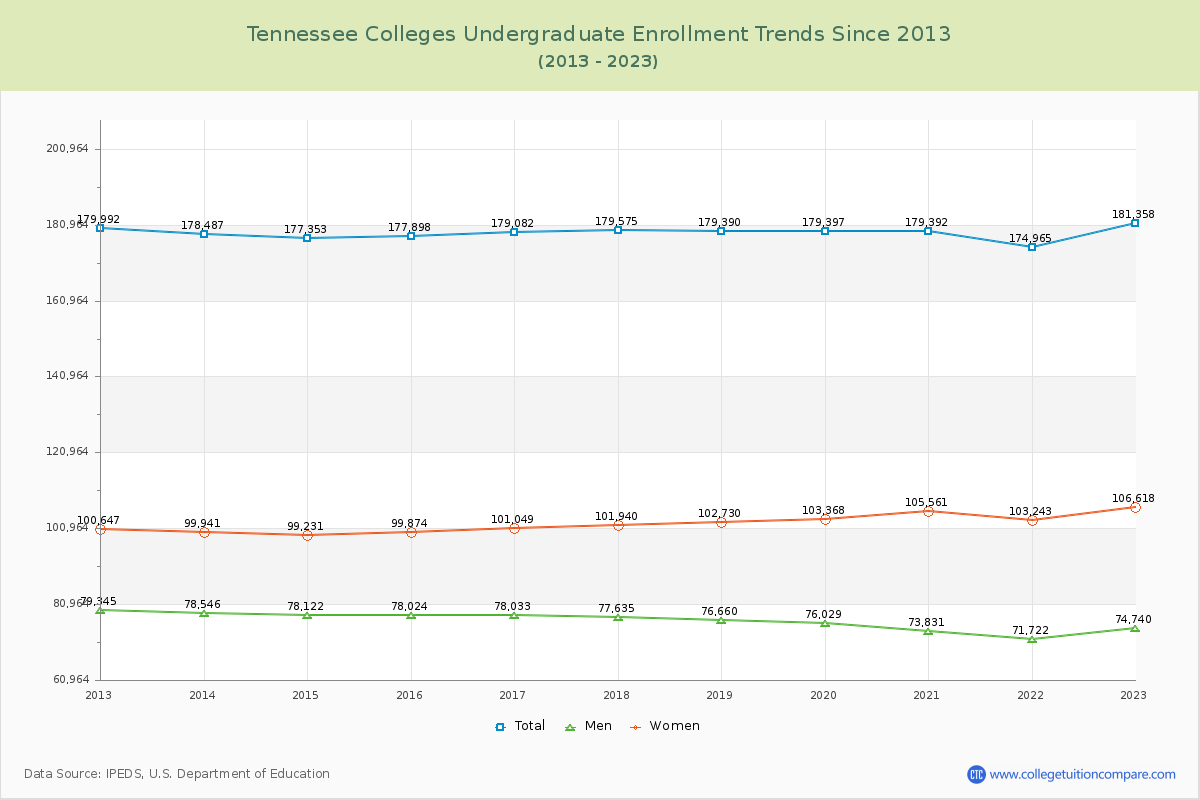
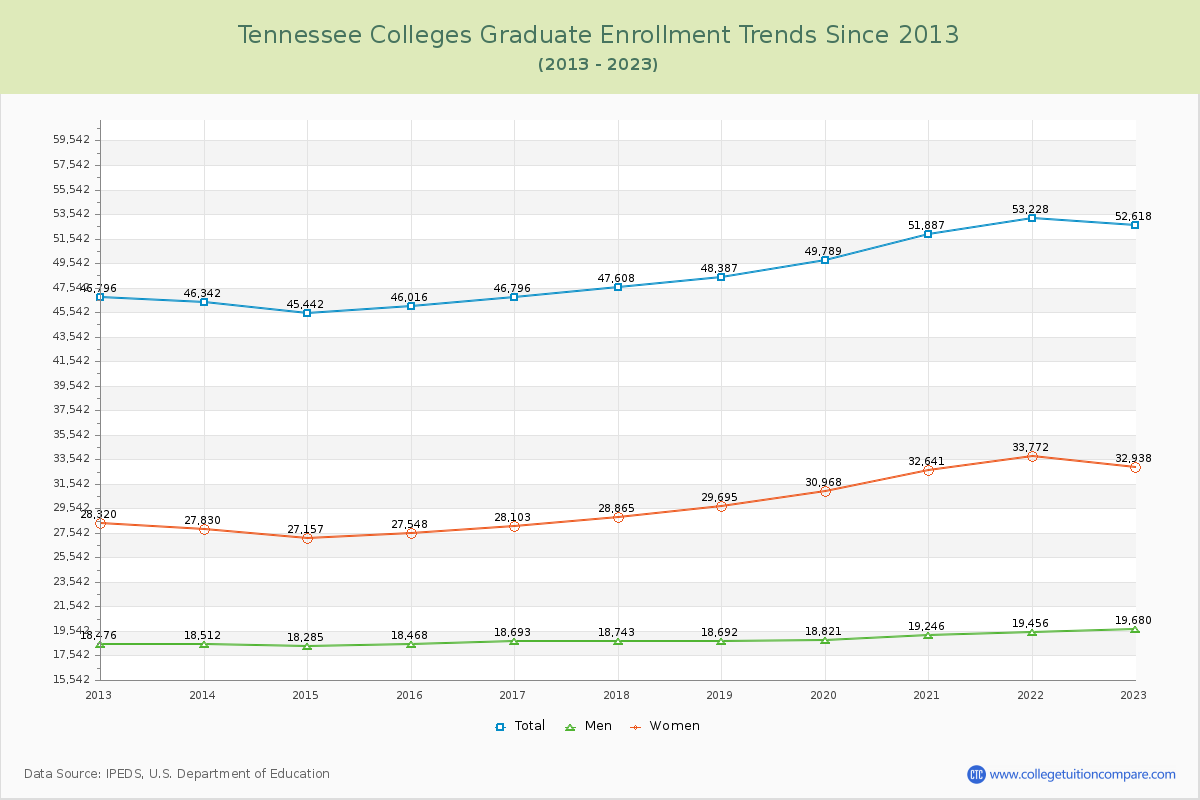
The average number of students over the past 11 years is 227,436, and 233,976 students were attending the schools in the academic year 2022-2023. Of the total students, 77.51% are undergraduate students and 22.49% are graduate students. Over the past 11, the number of undergraduate students increased by 1,382, and the graduate student enrollment increased by 5,825.
The female to male ratio is 1.48 to 1, meaning that there are more female students enrolled in Tennessee Colleges than male students.
The following table and chart illustrate the changes in student population by gender at Tennessee Colleges since 2013.
| Year | Total | Undergraduate | Graduate | ||||
|---|---|---|---|---|---|---|---|
| Total | Men | Women | Total | Men | Women | ||
| 2012-13 | 226,788 | 179,992 | 79,345 | 100,647 | 46,796 | 18,476 | 28,320 |
| 2013-14 | 224,829 -1,959 | 178,487 -1,505 | 78,546 -799 | 99,941 -706 | 46,342 -454 | 18,512 36 | 27,830 -490 |
| 2014-15 | 222,795 -2,034 | 177,353 -1,134 | 78,122 -424 | 99,231 -710 | 45,442 -900 | 18,285 -227 | 27,157 -673 |
| 2015-16 | 223,914 1,119 | 177,898 545 | 78,024 -98 | 99,874 643 | 46,016 574 | 18,468 183 | 27,548 391 |
| 2016-17 | 225,878 1,964 | 179,082 1,184 | 78,033 9 | 101,049 1,175 | 46,796 780 | 18,693 225 | 28,103 555 |
| 2017-18 | 227,183 1,305 | 179,575 493 | 77,635 -398 | 101,940 891 | 47,608 812 | 18,743 50 | 28,865 762 |
| 2018-19 | 227,777 594 | 179,390 -185 | 76,660 -975 | 102,730 790 | 48,387 779 | 18,692 -51 | 29,695 830 |
| 2019-20 | 229,186 1,409 | 179,397 7 | 76,029 -631 | 103,368 638 | 49,789 1,402 | 18,821 129 | 30,968 1,273 |
| 2020-21 | 231,279 2,093 | 179,392 -5 | 73,831 -2,198 | 105,561 2,193 | 51,887 2,098 | 19,246 425 | 32,641 1,673 |
| 2021-22 | 228,193 -3,086 | 174,965 -4,427 | 71,722 -2,109 | 103,243 -2,318 | 53,228 1,341 | 19,456 210 | 33,772 1,131 |
| 2022-23 | 233,976 5,783 | 181,358 6,393 | 74,740 3,018 | 106,618 3,375 | 52,618 -610 | 19,680 224 | 32,938 -834 |
| Average | 227,436 | 178,808 | 76,608 | 102,200 | 48,628 | 18,825 | 29,803 |