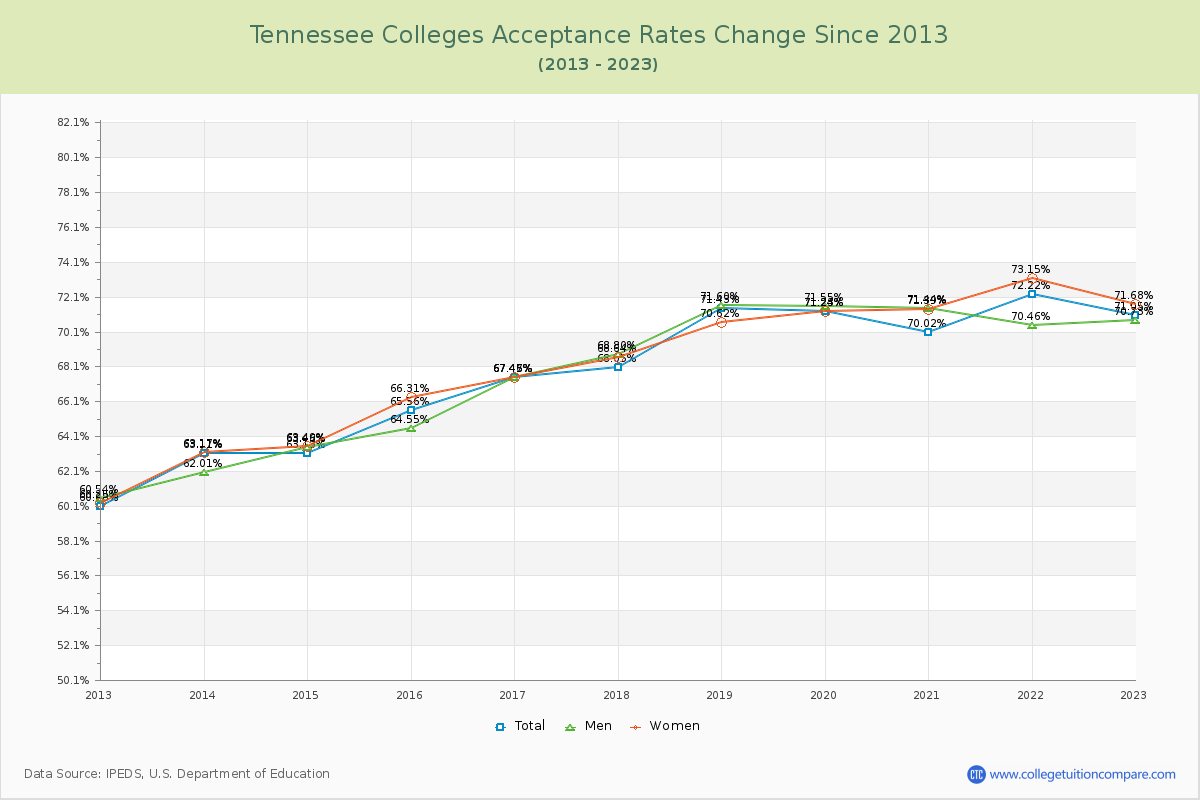
Acceptance Rate Changes
The average acceptance rate over the last 10 years is 67.58% where the current academic year rate is 71.05% at Tennessee Colleges. By gender, men students' acceptance rate is 67.51% and women students' rate is 67.95%. The next table and chart illustrate the acceptance rates changes at Tennessee Colleges over the past 11 years (2012-2023).
| Year | Total | Men | Women |
|---|---|---|---|
| 2012-13 | 60.08% | 60.54% | 60.25% |
| 2013-14 | 63.11% 3.03% |
62.01% 2.92% |
63.17% 2.92% |
| 2014-15 | 63.13% 0.02% |
63.46% 0.31% |
63.49% 0.31% |
| 2015-16 | 65.56% 2.44% |
64.55% 2.83% |
66.31% 2.83% |
| 2016-17 | 67.47% 1.91% |
67.45% 1.15% |
67.46% 1.15% |
| 2017-18 | 68.05% 0.58% |
68.80% 1.18% |
68.64% 1.18% |
| 2018-19 | 71.43% 3.37% |
71.60% 1.98% |
70.62% 1.98% |
| 2019-20 | 71.24% -0.19% |
71.55% 0.62% |
71.23% 0.62% |
| 2020-21 | 70.02% -1.22% |
71.44% 0.15% |
71.39% 0.15% |
| 2021-22 | 72.22% 2.19% |
70.46% 1.77% |
73.15% 1.77% |
| 2022-23 | 71.05% -1.17% |
70.73% -1.48% |
71.68% -1.48% |
| Average | 67.58% | 67.51% | 67.95% |