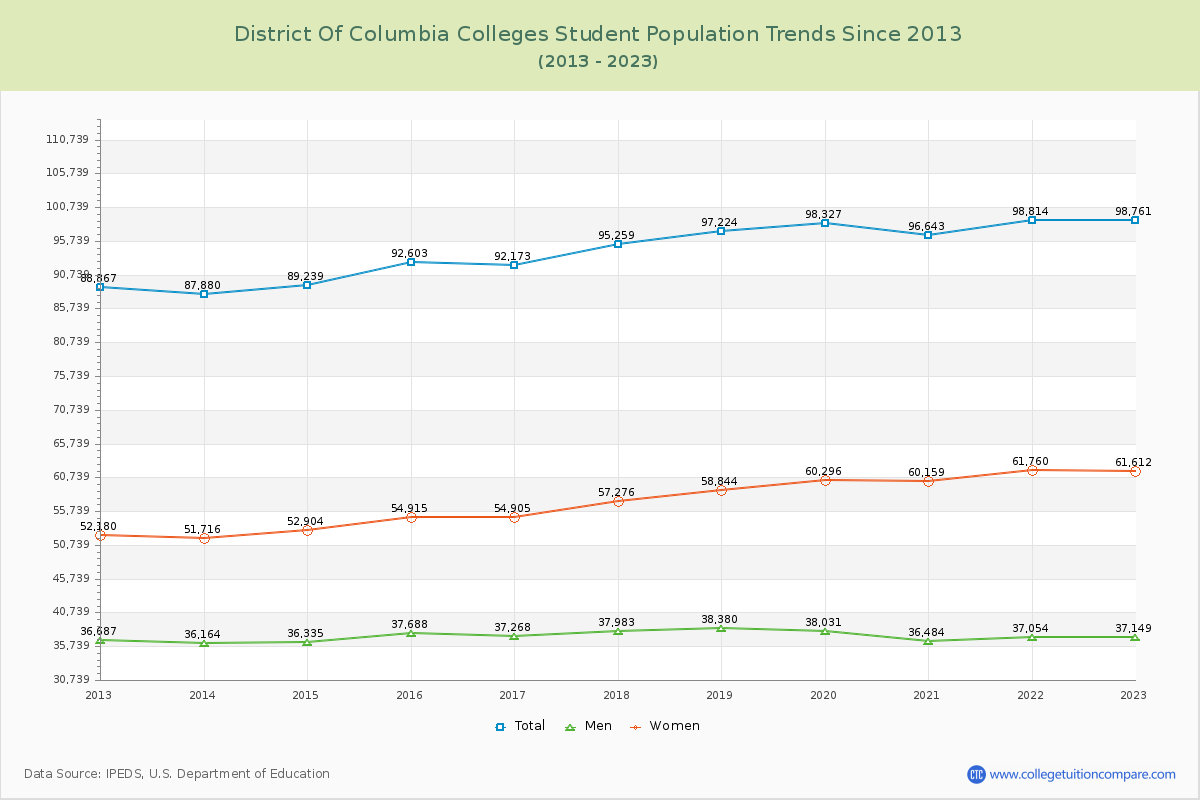
Student Population Changes
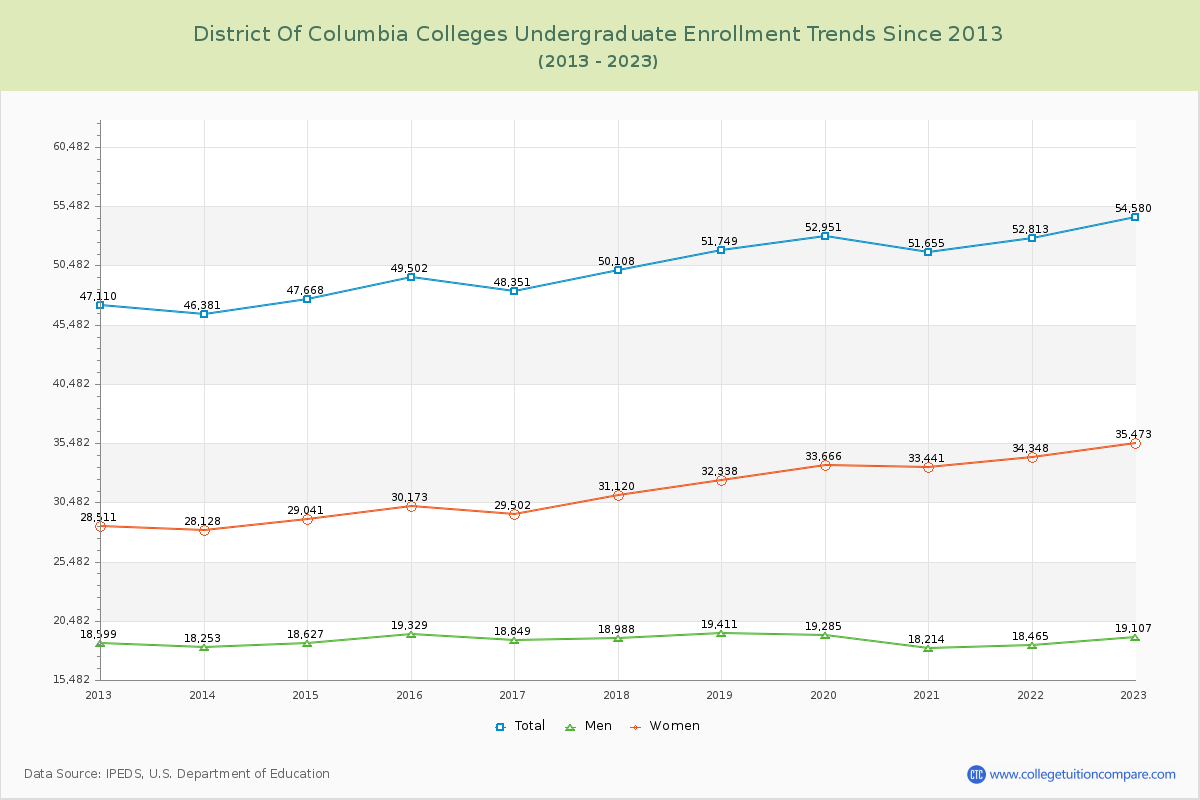
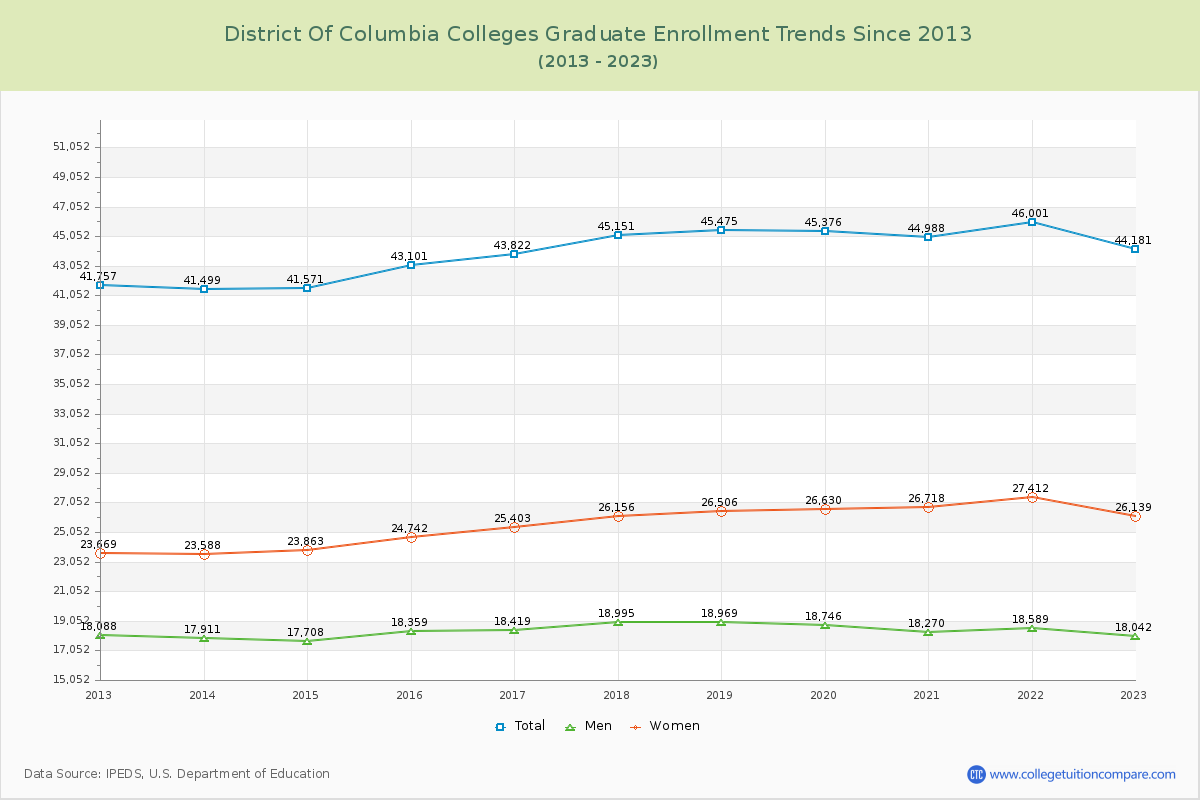
The average number of students over the past 11 years is 94,163, and 98,761 students were attending the schools in the academic year 2022-2023. Of the total students, 55.26% are undergraduate students and 44.74% are graduate students. Over the past 11, the number of undergraduate students increased by 7,470, and the graduate student enrollment increased by 2,424.
The female to male ratio is 1.66 to 1, meaning that there are more female students enrolled in District of Columbia Colleges than male students.
The following table and chart illustrate the changes in student population by gender at District of Columbia Colleges since 2013.
| Year | Total | Undergraduate | Graduate | ||||
|---|---|---|---|---|---|---|---|
| Total | Men | Women | Total | Men | Women | ||
| 2012-13 | 88,867 | 47,110 | 18,599 | 28,511 | 41,757 | 18,088 | 23,669 |
| 2013-14 | 87,880 -987 | 46,381 -729 | 18,253 -346 | 28,128 -383 | 41,499 -258 | 17,911 -177 | 23,588 -81 |
| 2014-15 | 89,239 1,359 | 47,668 1,287 | 18,627 374 | 29,041 913 | 41,571 72 | 17,708 -203 | 23,863 275 |
| 2015-16 | 92,603 3,364 | 49,502 1,834 | 19,329 702 | 30,173 1,132 | 43,101 1,530 | 18,359 651 | 24,742 879 |
| 2016-17 | 92,173 -430 | 48,351 -1,151 | 18,849 -480 | 29,502 -671 | 43,822 721 | 18,419 60 | 25,403 661 |
| 2017-18 | 95,259 3,086 | 50,108 1,757 | 18,988 139 | 31,120 1,618 | 45,151 1,329 | 18,995 576 | 26,156 753 |
| 2018-19 | 97,224 1,965 | 51,749 1,641 | 19,411 423 | 32,338 1,218 | 45,475 324 | 18,969 -26 | 26,506 350 |
| 2019-20 | 98,327 1,103 | 52,951 1,202 | 19,285 -126 | 33,666 1,328 | 45,376 -99 | 18,746 -223 | 26,630 124 |
| 2020-21 | 96,643 -1,684 | 51,655 -1,296 | 18,214 -1,071 | 33,441 -225 | 44,988 -388 | 18,270 -476 | 26,718 88 |
| 2021-22 | 98,814 2,171 | 52,813 1,158 | 18,465 251 | 34,348 907 | 46,001 1,013 | 18,589 319 | 27,412 694 |
| 2022-23 | 98,761 -53 | 54,580 1,767 | 19,107 642 | 35,473 1,125 | 44,181 -1,820 | 18,042 -547 | 26,139 -1,273 |
| Average | 94,163 | 50,261 | 18,830 | 31,431 | 43,902 | 18,372 | 25,530 |