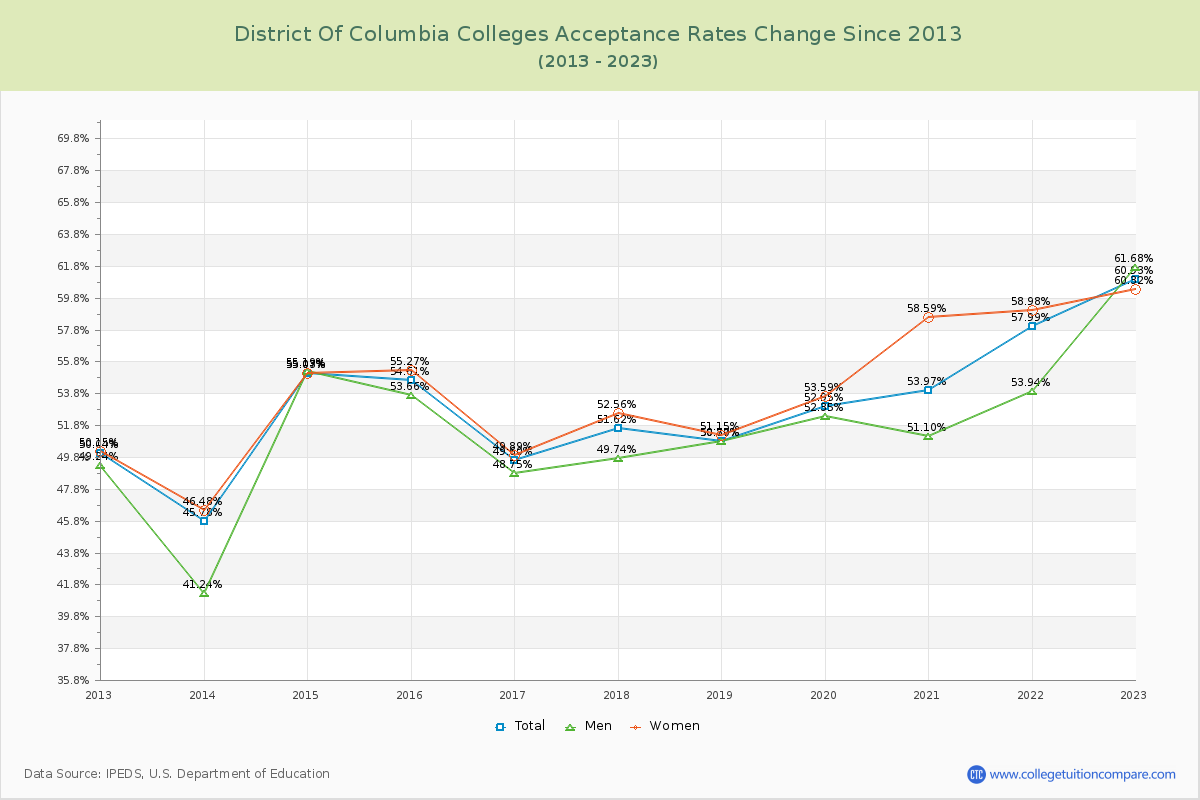
Acceptance Rate Changes
The average acceptance rate over the last 10 years is 53.03% where the current academic year rate is 60.93% at District of Columbia Colleges. By gender, men students' acceptance rate is 51.61% and women students' rate is 53.82%. The next table and chart illustrate the acceptance rates changes at District of Columbia Colleges over the past 11 years (2012-2023).
| Year | Total | Men | Women |
|---|---|---|---|
| 2012-13 | 50.04% | 49.24% | 50.15% |
| 2013-14 | 45.78% -4.26% |
41.24% -3.67% |
46.48% -3.67% |
| 2014-15 | 55.07% 9.29% |
55.19% 8.55% |
55.03% 8.55% |
| 2015-16 | 54.61% -0.46% |
53.66% 0.24% |
55.27% 0.24% |
| 2016-17 | 49.60% -5.01% |
48.75% -5.38% |
49.89% -5.38% |
| 2017-18 | 51.62% 2.02% |
49.74% 2.67% |
52.56% 2.67% |
| 2018-19 | 50.77% -0.85% |
50.80% -1.41% |
51.15% -1.41% |
| 2019-20 | 52.95% 2.18% |
52.35% 2.44% |
53.59% 2.44% |
| 2020-21 | 53.97% 1.02% |
51.10% 5.00% |
58.59% 5.00% |
| 2021-22 | 57.99% 4.03% |
53.94% 0.39% |
58.98% 0.39% |
| 2022-23 | 60.93% 2.94% |
61.68% 1.34% |
60.32% 1.34% |
| Average | 53.03% | 51.61% | 53.82% |