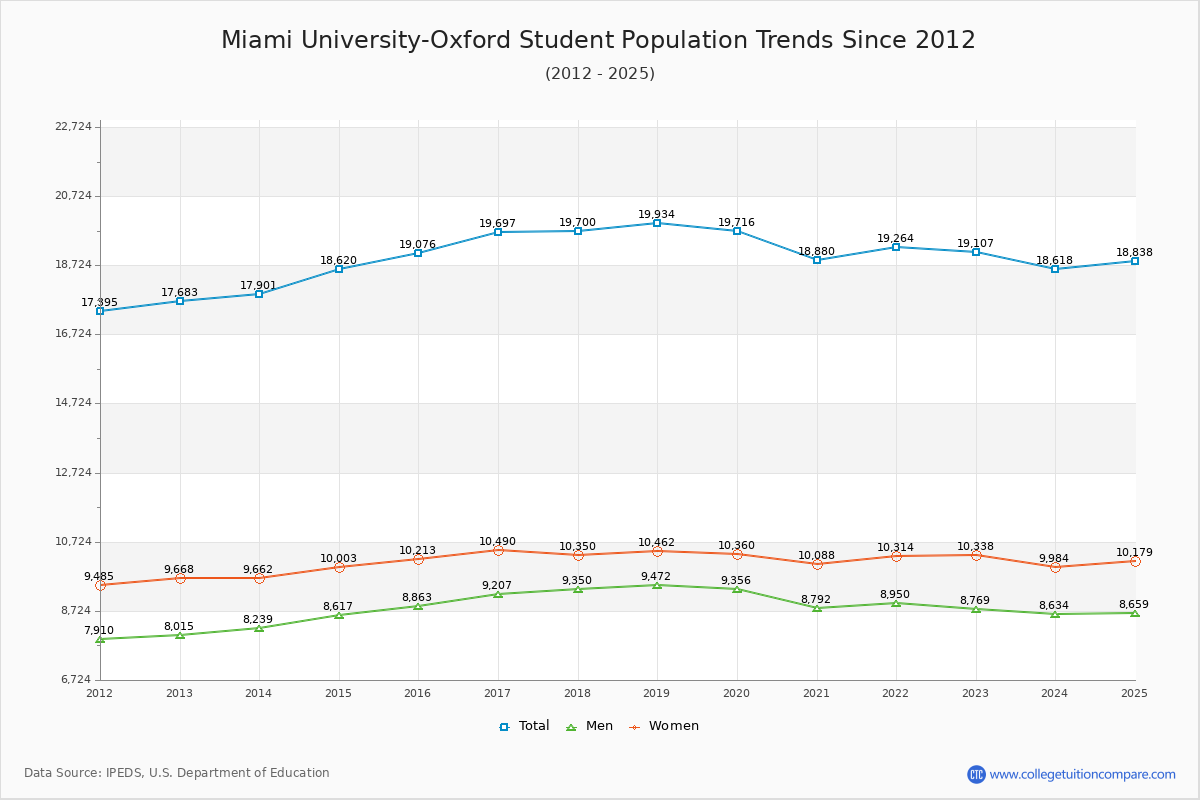
Student Population Changes
The average student population over the last 12 years is 19,053 where 19,107 students are attending the school for the academic year 2022-2023.
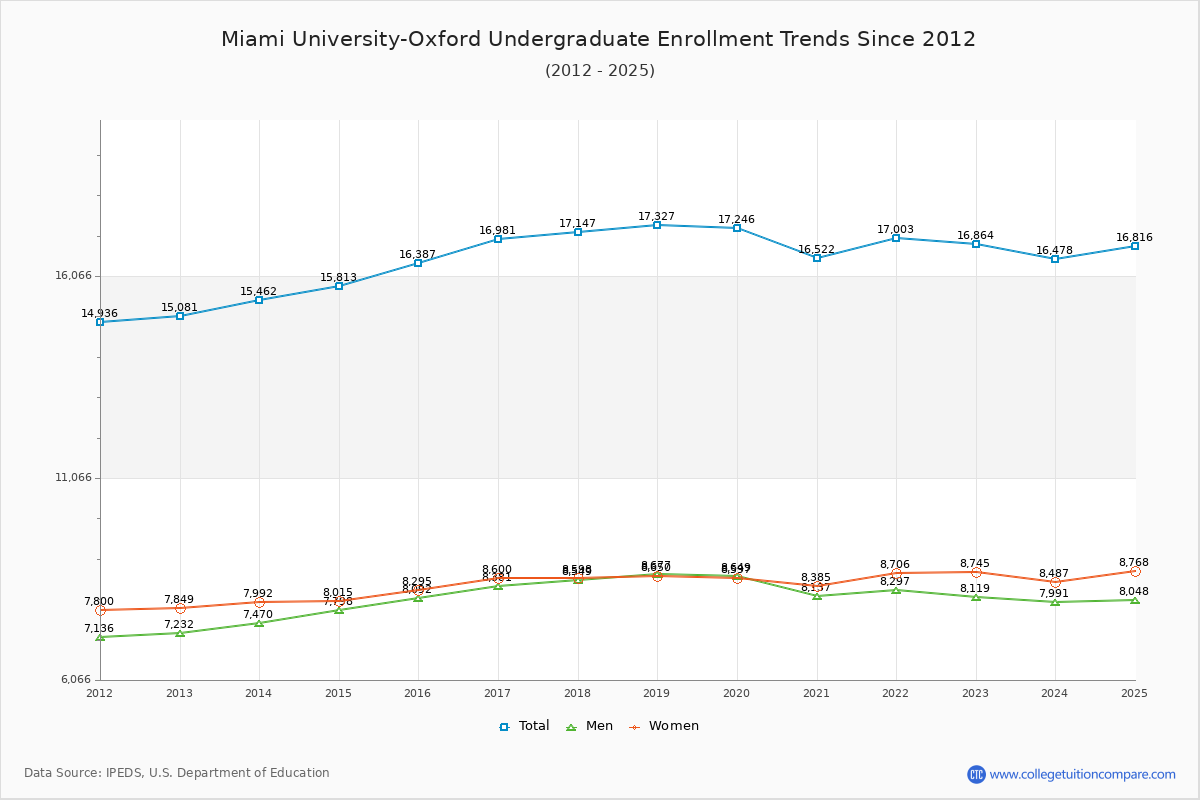
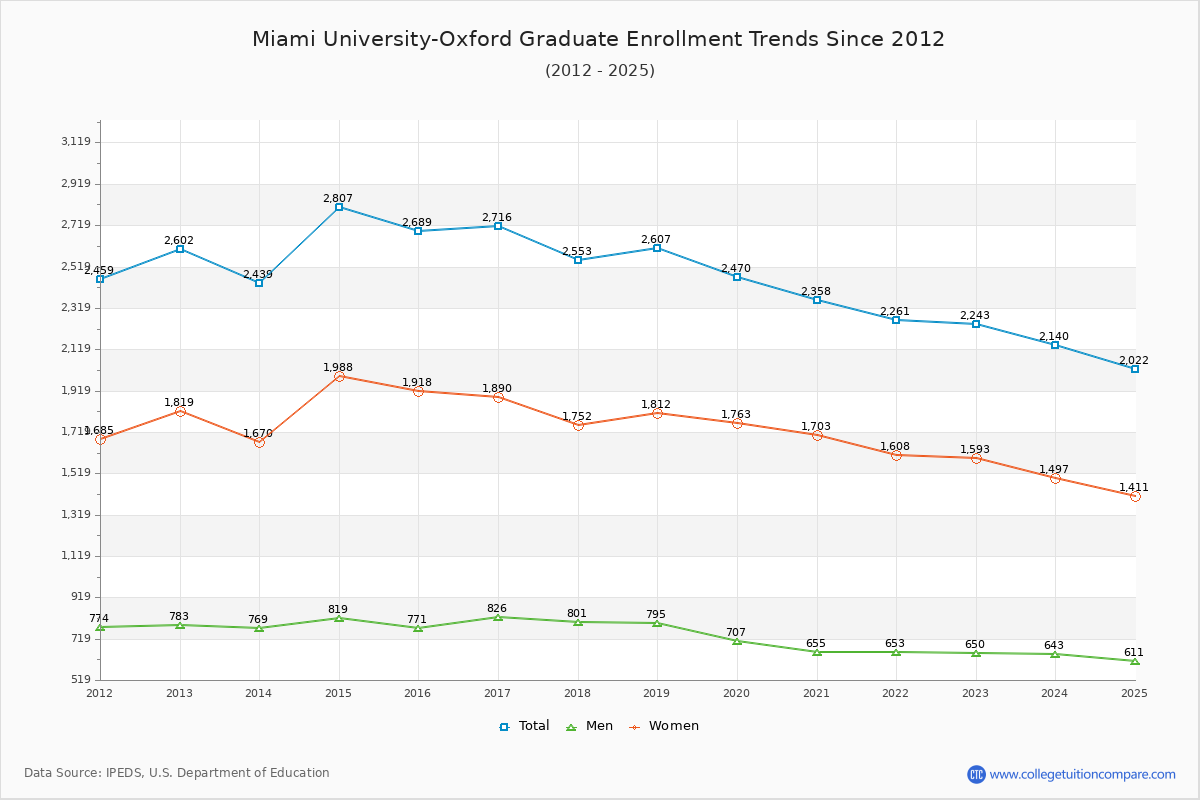
88.26% of total students is undergraduate students and 11.74% students is graduate students. The number of undergraduate students has increased by 1,783 and the graduate enrollment has decreased by 359 over past 10 years.
The female to male ratio is 1.18 to 1 and it means that there are slightly more female students enrolled in Miami of Ohio than male students.
The following table and chart illustrate the changes in student population by gender at Miami University-Oxford since 2012.
| Year | Total | Undergraduate | Graduate | ||||
|---|---|---|---|---|---|---|---|
| Total | Men | Women | Total | Men | Women | ||
| 2012-13 | 17,683 | 15,081 | 7,232 | 7,849 | 2,602 | 783 | 1,819 |
| 2013-14 | 17,901 218 | 15,462 381 | 7,470 238 | 7,992 143 | 2,439 -163 | 769 -14 | 1,670 -149 |
| 2014-15 | 18,620 719 | 15,813 351 | 7,798 328 | 8,015 23 | 2,807 368 | 819 50 | 1,988 318 |
| 2015-16 | 19,076 456 | 16,387 574 | 8,092 294 | 8,295 280 | 2,689 -118 | 771 -48 | 1,918 -70 |
| 2016-17 | 19,697 621 | 16,981 594 | 8,381 289 | 8,600 305 | 2,716 27 | 826 55 | 1,890 -28 |
| 2017-18 | 19,700 3 | 17,147 166 | 8,549 168 | 8,598 -2 | 2,553 -163 | 801 -25 | 1,752 -138 |
| 2018-19 | 19,934 234 | 17,327 180 | 8,677 128 | 8,650 52 | 2,607 54 | 795 -6 | 1,812 60 |
| 2019-20 | 19,716 -218 | 17,246 -81 | 8,649 -28 | 8,597 -53 | 2,470 -137 | 707 -88 | 1,763 -49 |
| 2020-21 | 18,880 -836 | 16,522 -724 | 8,137 -512 | 8,385 -212 | 2,358 -112 | 655 -52 | 1,703 -60 |
| 2021-22 | 19,264 384 | 17,003 481 | 8,297 160 | 8,706 321 | 2,261 -97 | 653 -2 | 1,608 -95 |
| 2022-23 | 19,107 -157 | 16,864 -139 | 8,119 -178 | 8,745 39 | 2,243 -18 | 650 -3 | 1,593 -15 |
| Average | 19,053 | 16,530 | 8,127 | 8,403 | 2,522 | 748 | 1,774 |