Student Population by Gender
Miami University-Oxford has a total of 19,107 enrolled students for the academic year 2022-2023. 16,864 students have enrolled in undergraduate programs and 2,243 students joined graduate programs.
By gender, 8,769 male and 10,338 female students (the male-female ratio is 46:54) are attending the school. The gender distribution is based on the 2022-2023 data.
| Total | Undergraduate | Graduate | |
|---|---|---|---|
| Total | 19,107 | 16,864 | 2,243 |
| Men | 8,769 | 8,119 | 650 |
| Women | 10,338 | 8,745 | 1,593 |
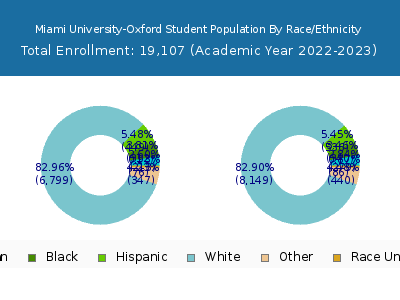
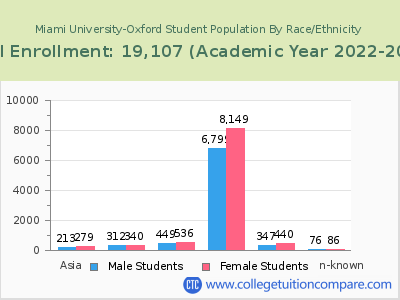
Student Distribution by Race/Ethnicity
| Race | Total | Men | Women |
|---|---|---|---|
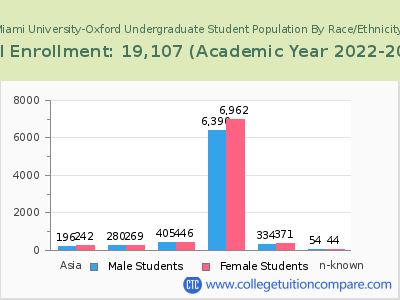
| American Indian or Native American | 35 | 18 | 17 |
| Asian | 496 | 208 | 288 |
| Black | 611 | 283 | 328 |
| Hispanic | 935 | 409 | 526 |
| Native Hawaiian or Other Pacific Islanders | 5 | 3 | 2 |
| White | 14,953 | 6,740 | 8,213 |
| Two or more races | 702 | 315 | 387 |
| Race Unknown | 247 | 109 | 138 |
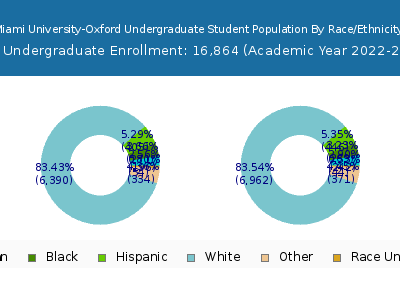
| Race | Total | Men | Women |
|---|---|---|---|
| American Indian or Native American | 34 | 18 | 16 |
| Asian | 434 | 187 | 247 |
| Black | 498 | 248 | 250 |
| Hispanic | 806 | 375 | 431 |
| Native Hawaiian or Other Pacific Islanders | 5 | 3 | 2 |
| White | 13,464 | 6,359 | 7,105 |
| Two or more races | 629 | 300 | 329 |
| Race Unknown | 165 | 86 | 79 |
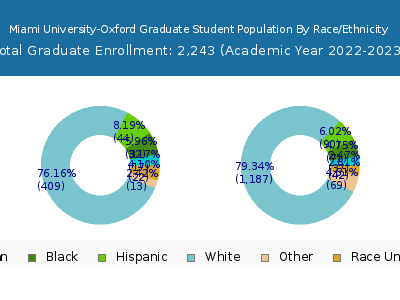
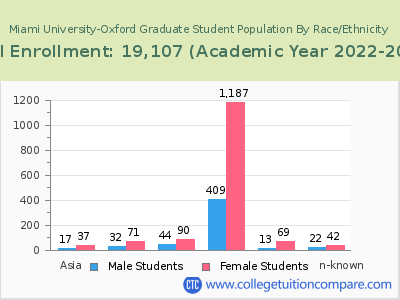
| Race | Total | Men | Women |
|---|---|---|---|
| American Indian or Native American | 0 | 0 | 0 |
| Asian | 6 | 3 | 3 |
| Black | 13 | 8 | 5 |
| Hispanic | 8 | 3 | 5 |
| Native Hawaiian or Other Pacific Islanders | 0 | 0 | 0 |
| White | 173 | 90 | 83 |
| Two or more races | 9 | 5 | 4 |
| Race Unknown | 1 | 1 | 0 |
Student Age Distribution
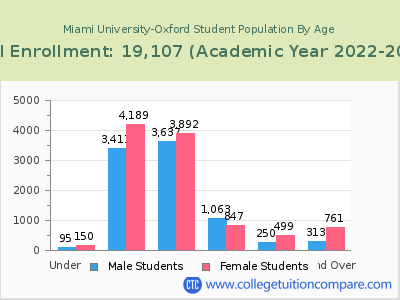
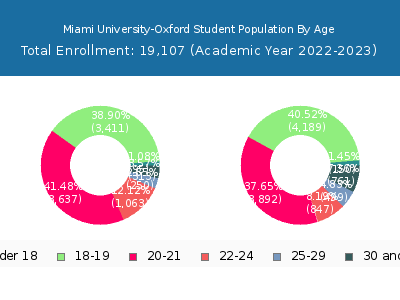
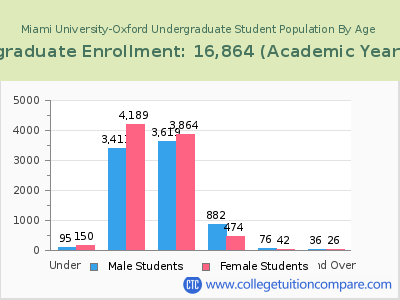
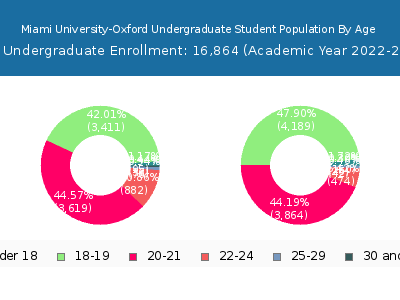
By age, Miami of Ohio has 245 students under 18 years old and 16 students over 65 years old. There are 17,284 students under 25 years old, and 1,823 students over 25 years old out of 19,107 total students.
In undergraduate programs, 245 students are younger than 18 and 5 students are older than 65. Miami of Ohio has 16,684 undergraduate students aged under 25 and 180 students aged 25 and over.
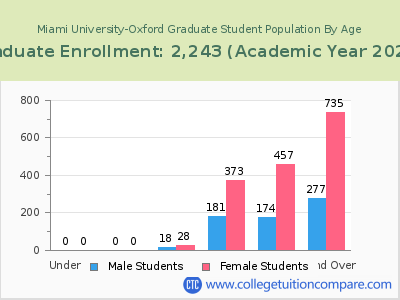
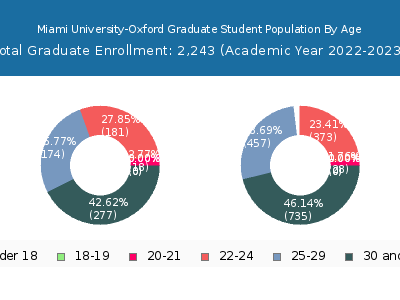
It has 600 graduate students aged under 25 and 1,643 students aged 25 and over.
| Age | Total | Men | Women |
|---|---|---|---|
| Under 18 | 245 | 150 | 95 |
| 18-19 | 7,600 | 4,189 | 3,411 |
| 20-21 | 7,529 | 3,892 | 3,637 |
| 22-24 | 1,910 | 847 | 1,063 |
| 25-29 | 749 | 499 | 250 |
| 30-34 | 401 | 256 | 145 |
| 35-39 | 235 | 166 | 69 |
| 40-49 | 296 | 230 | 66 |
| 50-64 | 126 | 103 | 23 |
| Over 65 | 16 | 6 | 10 |
| Age | Total | Men | Women |
|---|---|---|---|
| Under 18 | 245 | 150 | 95 |
| 18-19 | 7,600 | 4,189 | 3,411 |
| 20-21 | 7,483 | 3,864 | 3,619 |
| 22-24 | 1,356 | 474 | 882 |
| 25-29 | 118 | 42 | 76 |
| 30-34 | 21 | 4 | 17 |
| 35-39 | 12 | 10 | 2 |
| 40-49 | 17 | 9 | 8 |
| 50-64 | 7 | 2 | 5 |
| Over 65 | 5 | 1 | 4 |
| Age | Total | Men | Women |
|---|
Online Student Enrollment
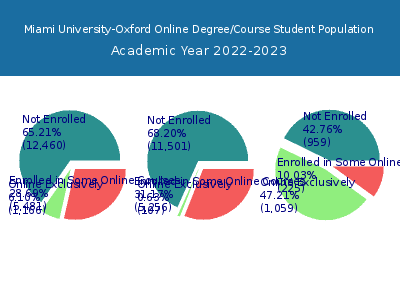
Distance learning, also called online education, is very attractive to students, especially who want to continue education and work in field. At Miami University-Oxford, 1,166 students are enrolled exclusively in online courses and 5,481 students are enrolled in some online courses.
476 students lived in Ohio or jurisdiction in which the school is located are enrolled exclusively in online courses and 690 students live in other State or outside of the United States.
| All Students | Enrolled Exclusively Online Courses | Enrolled in Some Online Courses | |
|---|---|---|---|
| All Students | 19,107 | 1,166 | 5,481 |
| Undergraduate | 16,864 | 107 | 5,256 |
| Graduate | 2,243 | 1,059 | 225 |
| Ohio Residents | Other States in U.S. | Outside of U.S. | |
|---|---|---|---|
| All Students | 476 | 681 | 9 |
| Undergraduate | 85 | 17 | 5 |
| Graduate | 391 | 664 | 4 |
Transfer-in Students (Undergraduate)
Among 16,864 enrolled in undergraduate programs, 226 students have transferred-in from other institutions. The percentage of transfer-in students is 1.34%.220 students have transferred in as full-time status and 6 students transferred in as part-time status.
| Number of Students | |
|---|---|
| Regular Full-time | 16,214 |
| Transfer-in Full-time | 220 |
| Regular Part-time | 424 |
| Transfer-in Part-time | 6 |
