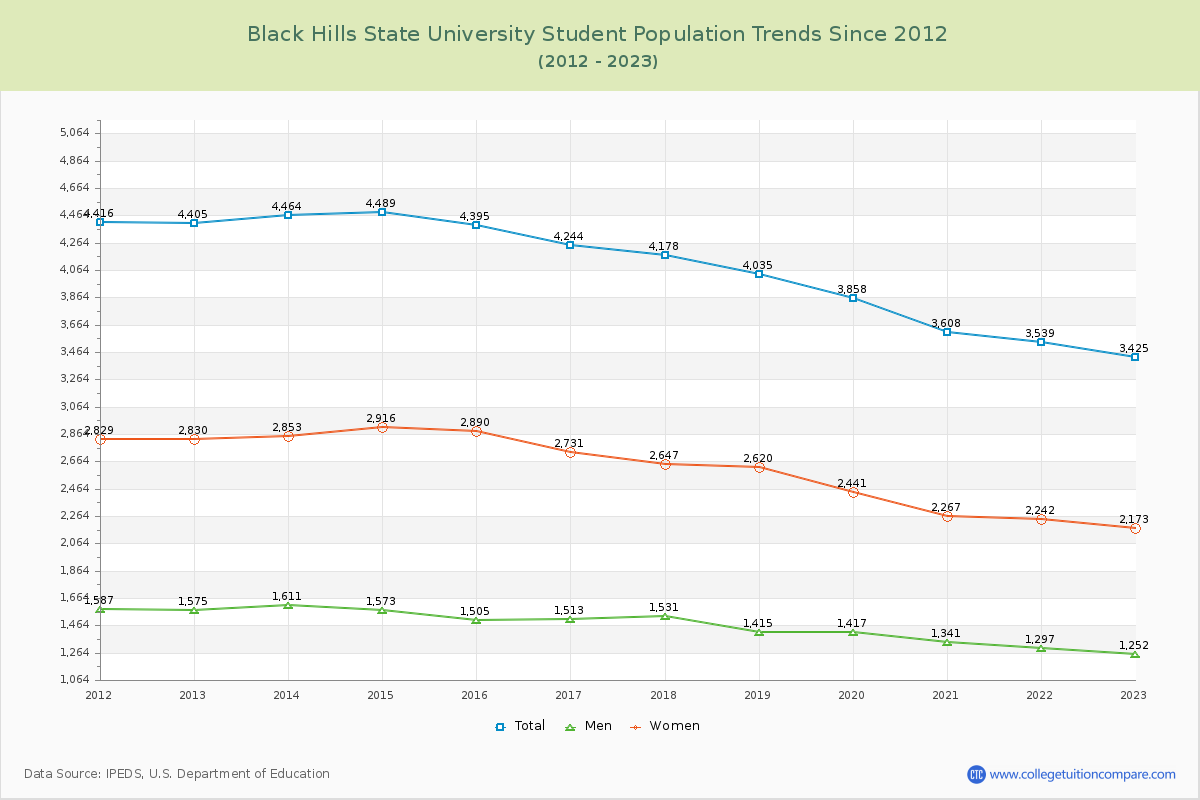
Student Population Changes
The average student population over the last 12 years is 4,058 where 3,425 students are attending the school for the academic year 2022-2023.
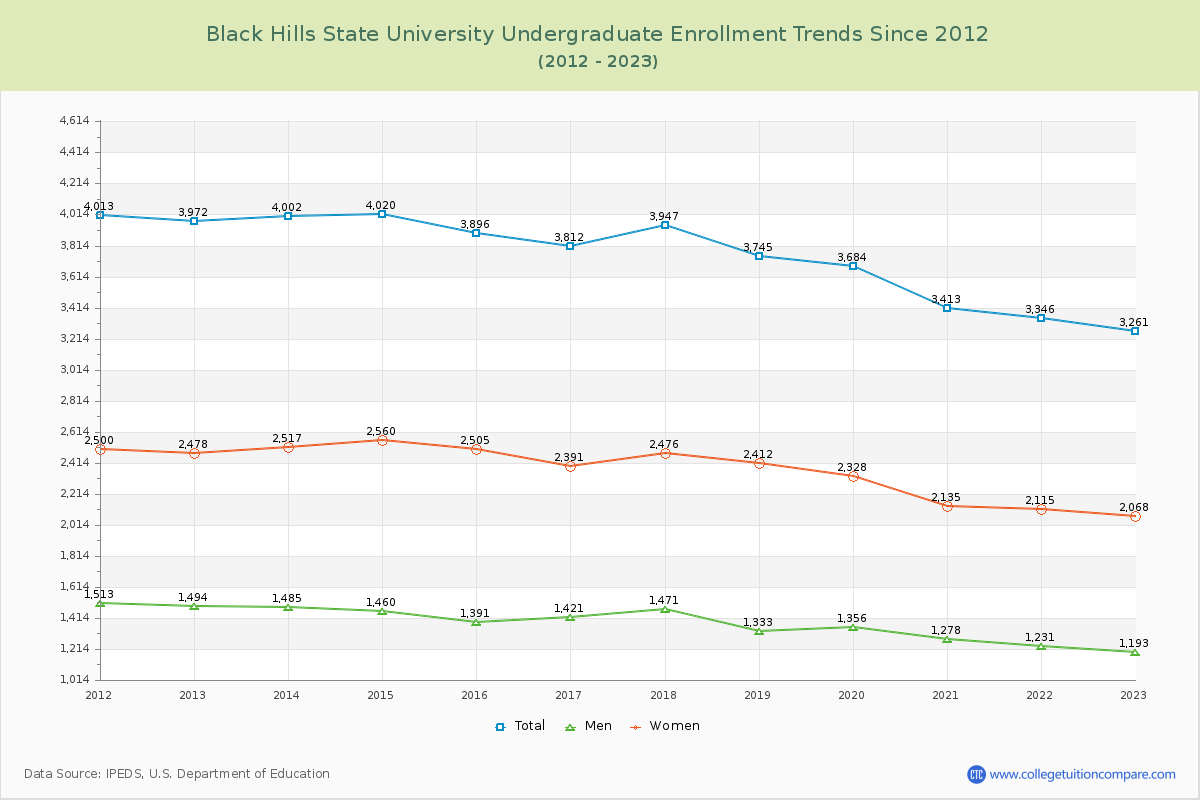
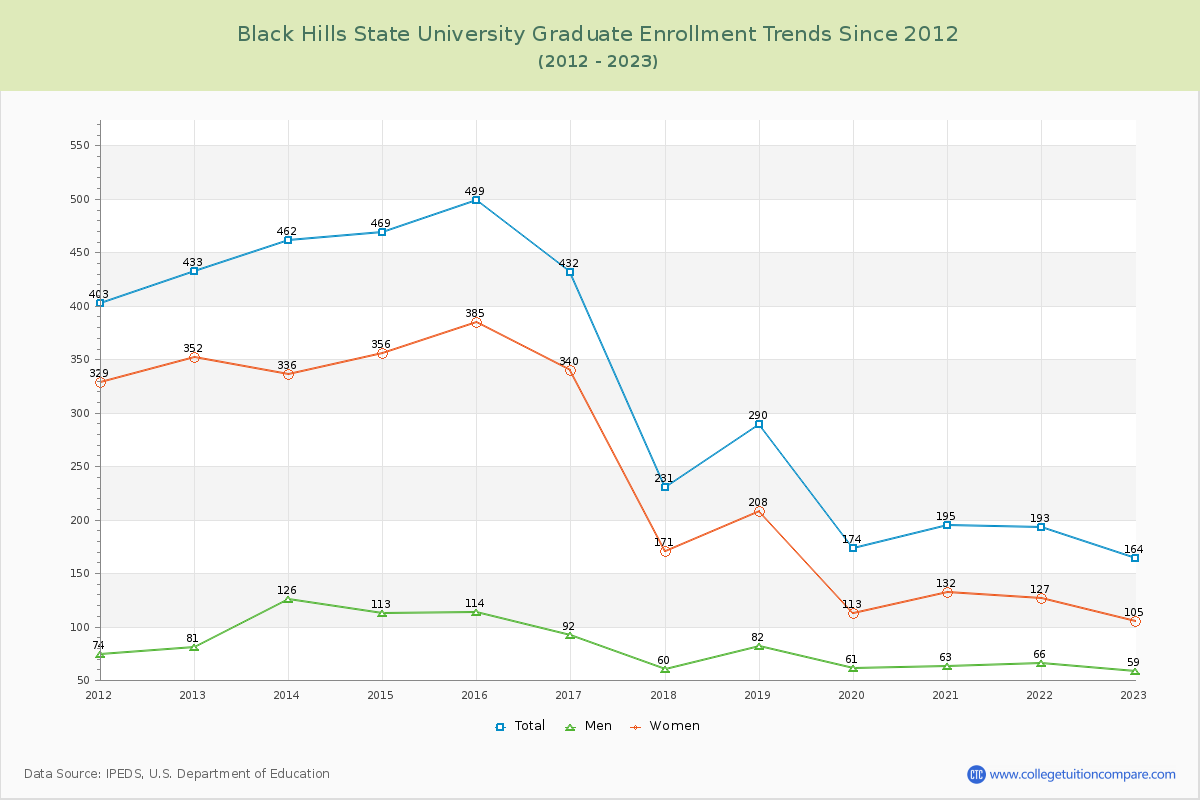
95.21% of total students is undergraduate students and 4.79% students is graduate students. The number of undergraduate students has decreased by 711 and the graduate enrollment has decreased by 269 over past 10 years.
The female to male ratio is 1.74 to 1 and it means that there are more female students enrolled in BHSU than male students.
The following table and chart illustrate the changes in student population by gender at Black Hills State University since 2012.
| Year | Total | Undergraduate | Graduate | ||||
|---|---|---|---|---|---|---|---|
| Total | Men | Women | Total | Men | Women | ||
| 2012-13 | 4,405 | 3,972 | 1,494 | 2,478 | 433 | 81 | 352 |
| 2013-14 | 4,464 59 | 4,002 30 | 1,485 -9 | 2,517 39 | 462 29 | 126 45 | 336 -16 |
| 2014-15 | 4,489 25 | 4,020 18 | 1,460 -25 | 2,560 43 | 469 7 | 113 -13 | 356 20 |
| 2015-16 | 4,395 -94 | 3,896 -124 | 1,391 -69 | 2,505 -55 | 499 30 | 114 1 | 385 29 |
| 2016-17 | 4,244 -151 | 3,812 -84 | 1,421 30 | 2,391 -114 | 432 -67 | 92 -22 | 340 -45 |
| 2017-18 | 4,178 -66 | 3,947 135 | 1,471 50 | 2,476 85 | 231 -201 | 60 -32 | 171 -169 |
| 2018-19 | 4,035 -143 | 3,745 -202 | 1,333 -138 | 2,412 -64 | 290 59 | 82 22 | 208 37 |
| 2019-20 | 3,858 -177 | 3,684 -61 | 1,356 23 | 2,328 -84 | 174 -116 | 61 -21 | 113 -95 |
| 2020-21 | 3,608 -250 | 3,413 -271 | 1,278 -78 | 2,135 -193 | 195 21 | 63 2 | 132 19 |
| 2021-22 | 3,539 -69 | 3,346 -67 | 1,231 -47 | 2,115 -20 | 193 -2 | 66 3 | 127 -5 |
| 2022-23 | 3,425 -114 | 3,261 -85 | 1,193 -38 | 2,068 -47 | 164 -29 | 59 -7 | 105 -22 |
| Average | 4,058 | 3,736 | 1,374 | 2,362 | 322 | 83 | 239 |