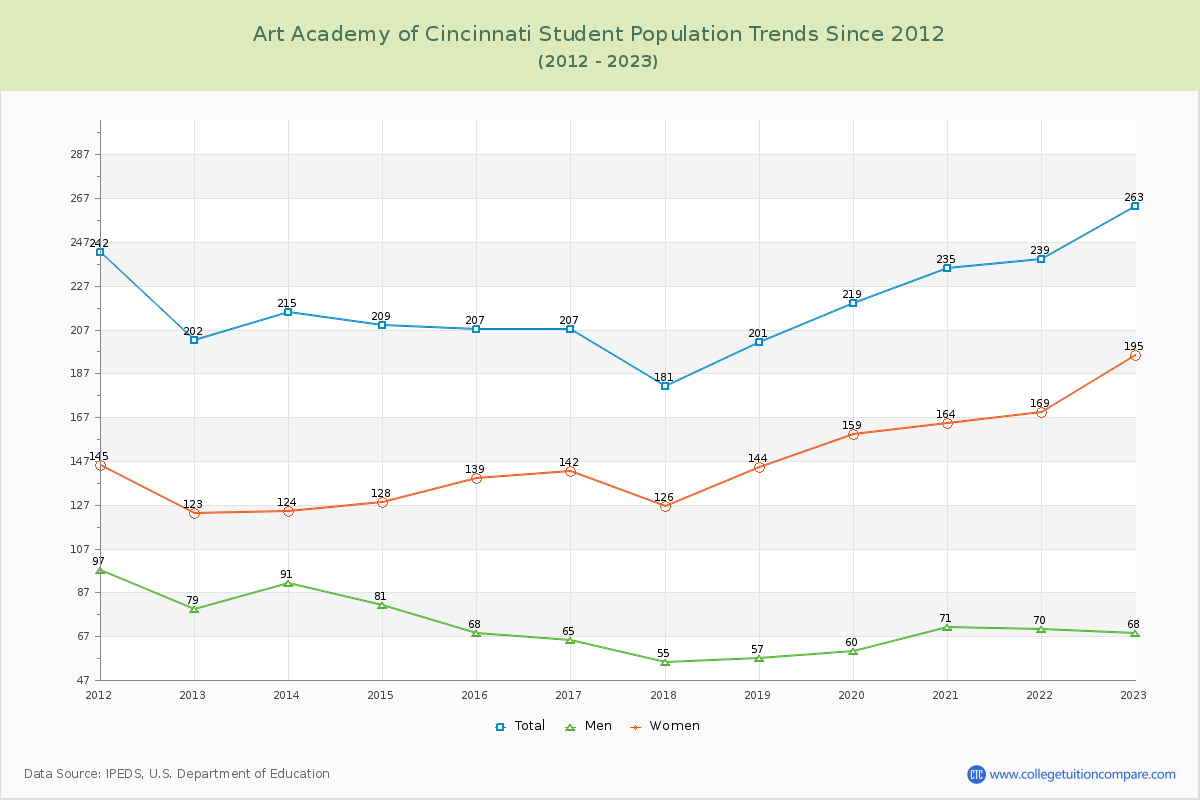
Student Population Changes
The average student population over the last 12 years is 216 where 263 students are attending the school for the academic year 2022-2023.
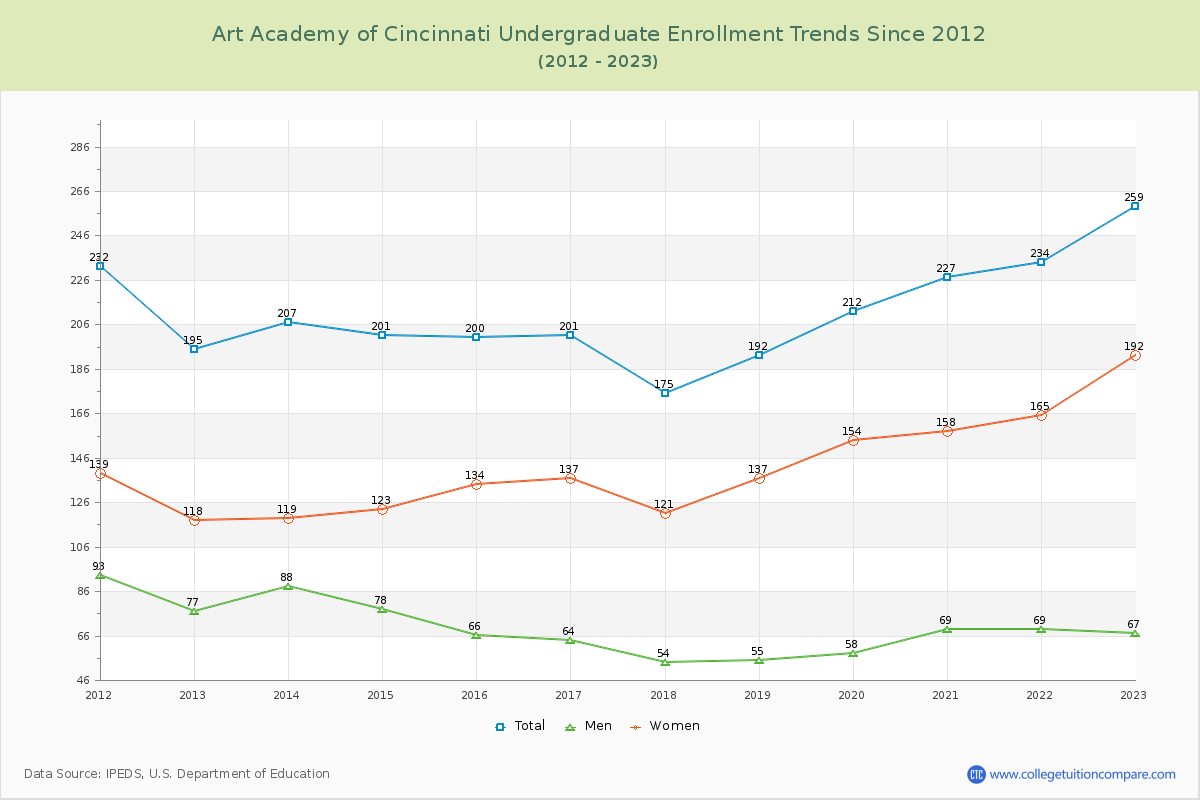
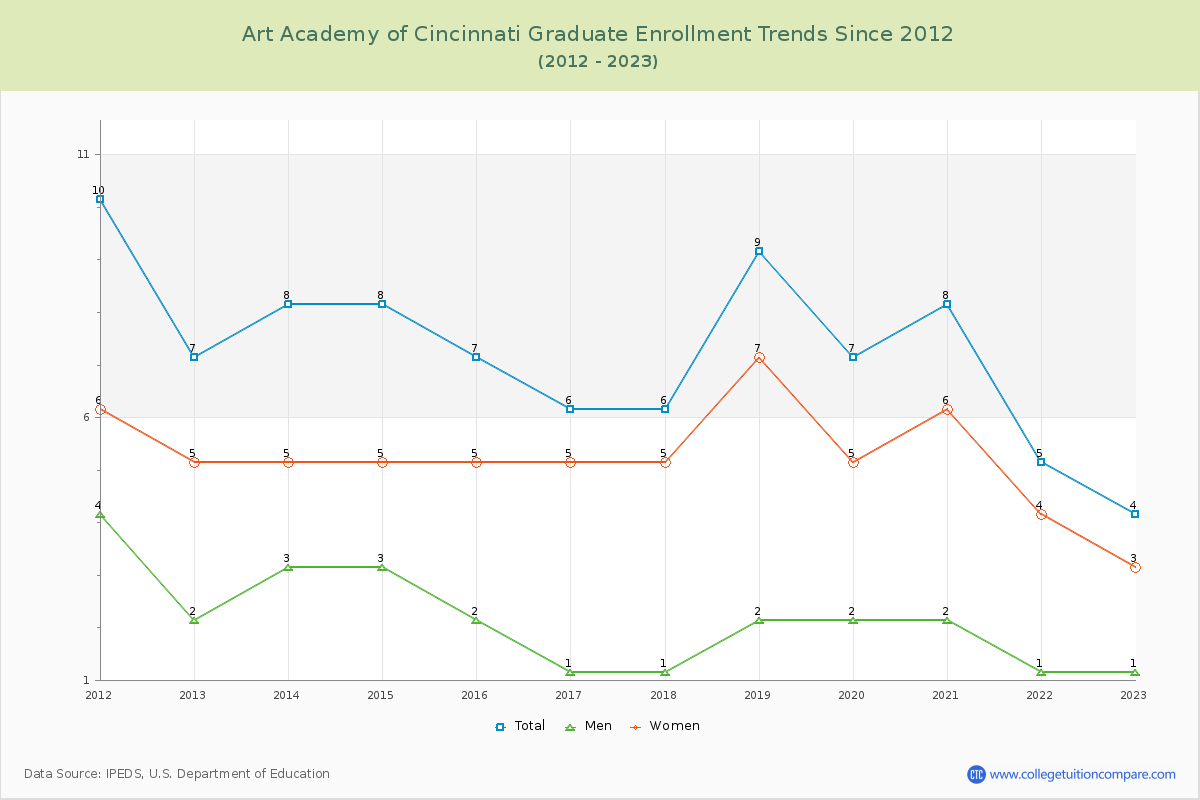
98.48% of total students is undergraduate students and 1.52% students is graduate students. The number of undergraduate students has increased by 64 and the graduate enrollment has decreased by 3 over past 10 years.
The female to male ratio is 2.87 to 1 and it means that there are far more female students enrolled in AAC than male students.
The following table and chart illustrate the changes in student population by gender at Art Academy of Cincinnati since 2012.
| Year | Total | Undergraduate | Graduate | ||||
|---|---|---|---|---|---|---|---|
| Total | Men | Women | Total | Men | Women | ||
| 2012-13 | 202 | 195 | 77 | 118 | 7 | 2 | 5 |
| 2013-14 | 215 13 | 207 12 | 88 11 | 119 1 | 8 1 | 3 1 | 5 0 |
| 2014-15 | 209 -6 | 201 -6 | 78 -10 | 123 4 | 8 0 | 3 0 | 5 0 |
| 2015-16 | 207 -2 | 200 -1 | 66 -12 | 134 11 | 7 -1 | 2 -1 | 5 0 |
| 2016-17 | 207 0 | 201 1 | 64 -2 | 137 3 | 6 -1 | 1 -1 | 5 0 |
| 2017-18 | 181 -26 | 175 -26 | 54 -10 | 121 -16 | 6 0 | 1 0 | 5 0 |
| 2018-19 | 201 20 | 192 17 | 55 1 | 137 16 | 9 3 | 2 1 | 7 2 |
| 2019-20 | 219 18 | 212 20 | 58 3 | 154 17 | 7 -2 | 2 0 | 5 -2 |
| 2020-21 | 235 16 | 227 15 | 69 11 | 158 4 | 8 1 | 2 0 | 6 1 |
| 2021-22 | 239 4 | 234 7 | 69 0 | 165 7 | 5 -3 | 1 -1 | 4 -2 |
| 2022-23 | 263 24 | 259 25 | 67 -2 | 192 27 | 4 -1 | 1 0 | 3 -1 |
| Average | 216 | 209 | 68 | 142 | 7 | 2 | 5 |