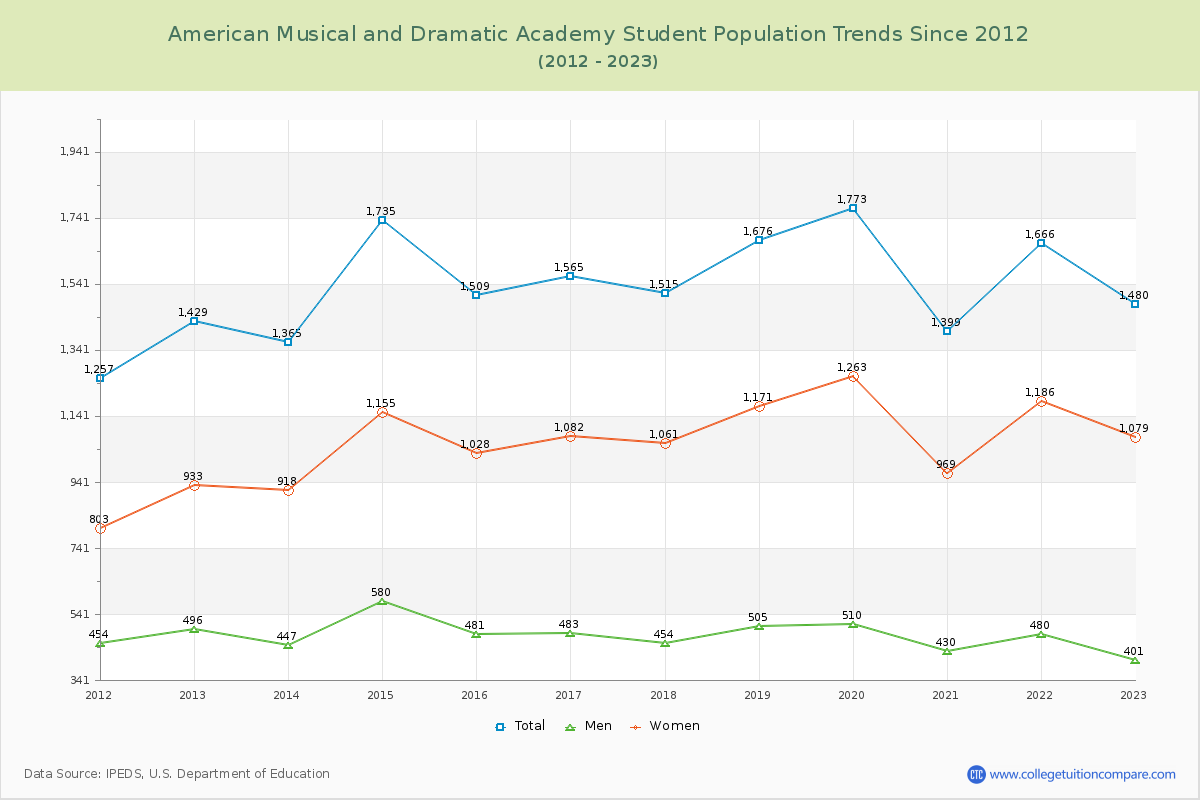
Student Population Changes
The average student population over the last 12 years is 1,556 where 1,480 students are attending the school for the academic year 2022-2023.
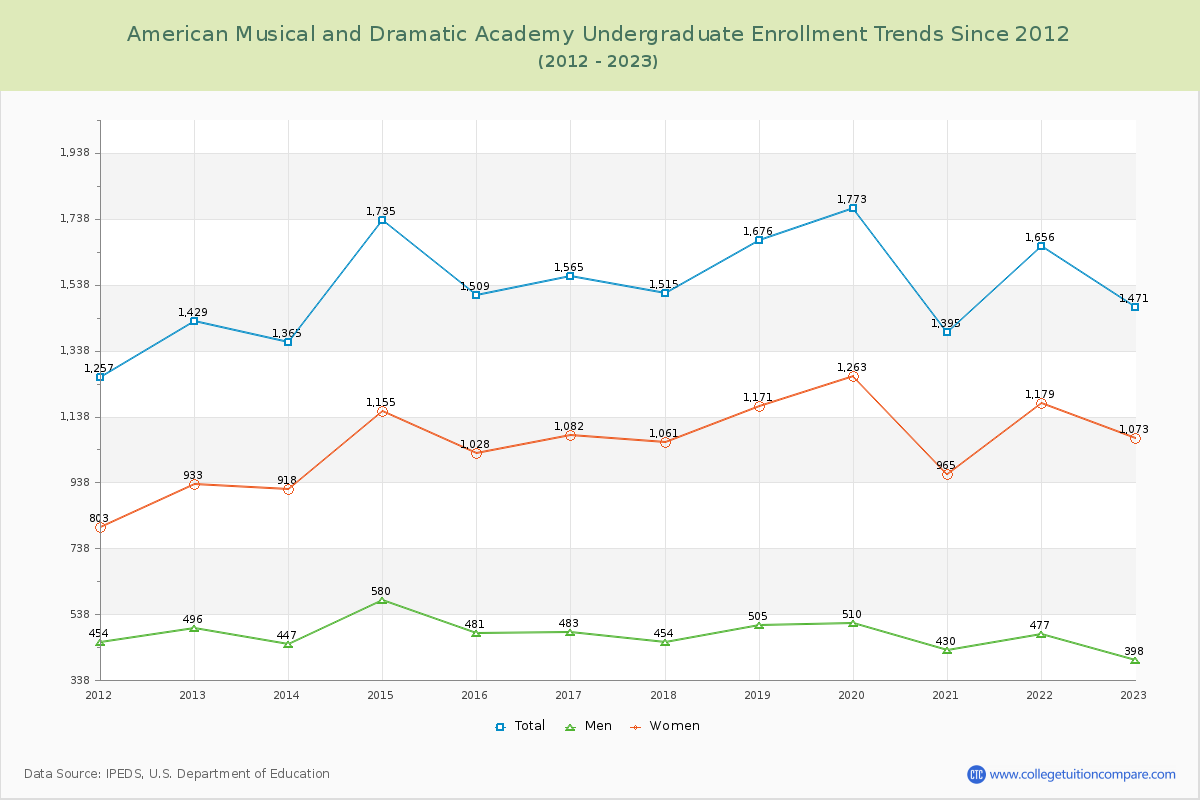
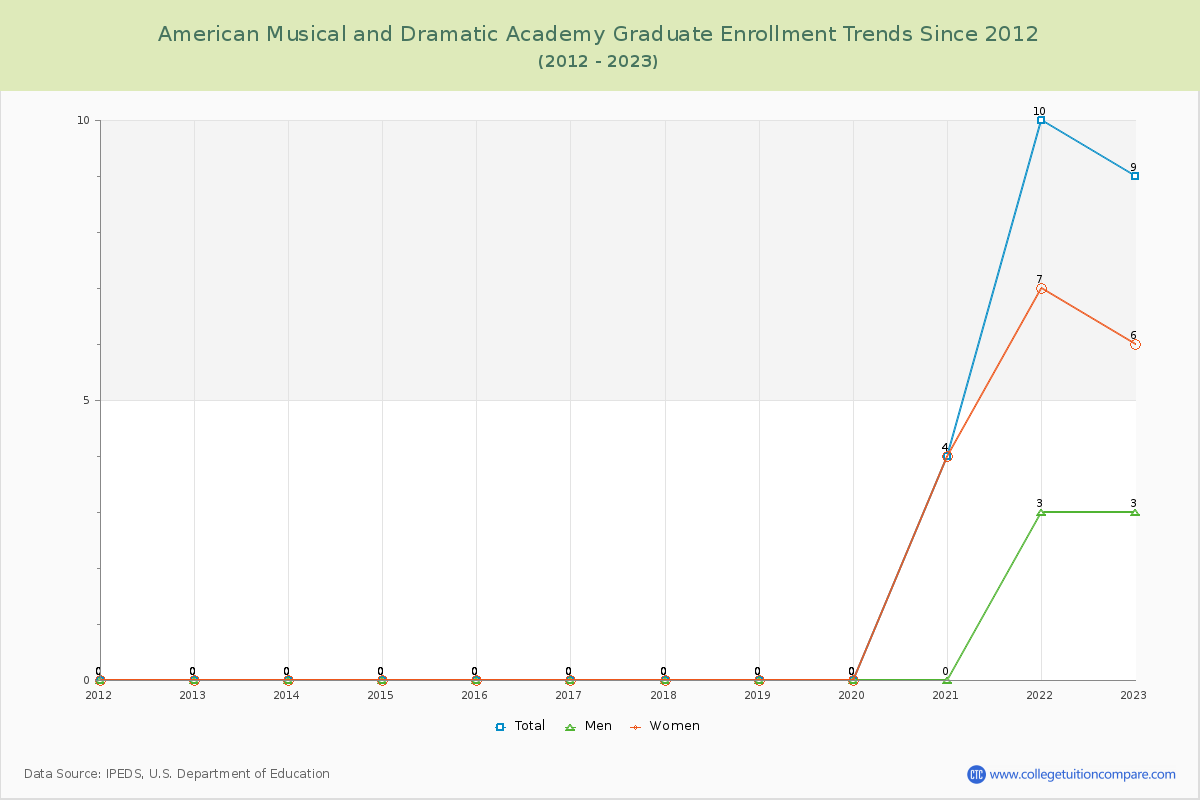
99.39% of total students is undergraduate students and 0.61% students is graduate students. The number of undergraduate students has increased by 42 and the graduate enrollment has increased by 9 over past 10 years.
The female to male ratio is 2.69 to 1 and it means that there are far more female students enrolled in American Musical and Dramatic Academy than male students.
The following table and chart illustrate the changes in student population by gender at American Musical and Dramatic Academy since 2012.
| Year | Total | Undergraduate | Graduate | ||||
|---|---|---|---|---|---|---|---|
| Total | Men | Women | Total | Men | Women | ||
| 2012-13 | 1,429 | 1,429 | 496 | 933 | 0 | 0 | 0 |
| 2013-14 | 1,365 -64 | 1,365 -64 | 447 -49 | 918 -15 | 0 0 | 0 0 | 0 0 |
| 2014-15 | 1,735 370 | 1,735 370 | 580 133 | 1,155 237 | 0 0 | 0 0 | 0 0 |
| 2015-16 | 1,509 -226 | 1,509 -226 | 481 -99 | 1,028 -127 | 0 0 | 0 0 | 0 0 |
| 2016-17 | 1,565 56 | 1,565 56 | 483 2 | 1,082 54 | 0 0 | 0 0 | 0 0 |
| 2017-18 | 1,515 -50 | 1,515 -50 | 454 -29 | 1,061 -21 | 0 0 | 0 0 | 0 0 |
| 2018-19 | 1,676 161 | 1,676 161 | 505 51 | 1,171 110 | 0 0 | 0 0 | 0 0 |
| 2019-20 | 1,773 97 | 1,773 97 | 510 5 | 1,263 92 | 0 0 | 0 0 | 0 0 |
| 2020-21 | 1,399 -374 | 1,395 -378 | 430 -80 | 965 -298 | 4 4 | 0 0 | 4 4 |
| 2021-22 | 1,666 267 | 1,656 261 | 477 47 | 1,179 214 | 10 6 | 3 3 | 7 3 |
| 2022-23 | 1,480 -186 | 1,471 -185 | 398 -79 | 1,073 -106 | 9 -1 | 3 0 | 6 -1 |
| Average | 1,556 | 1,554 | 478 | 1,075 | 2 | 1 | 2 |