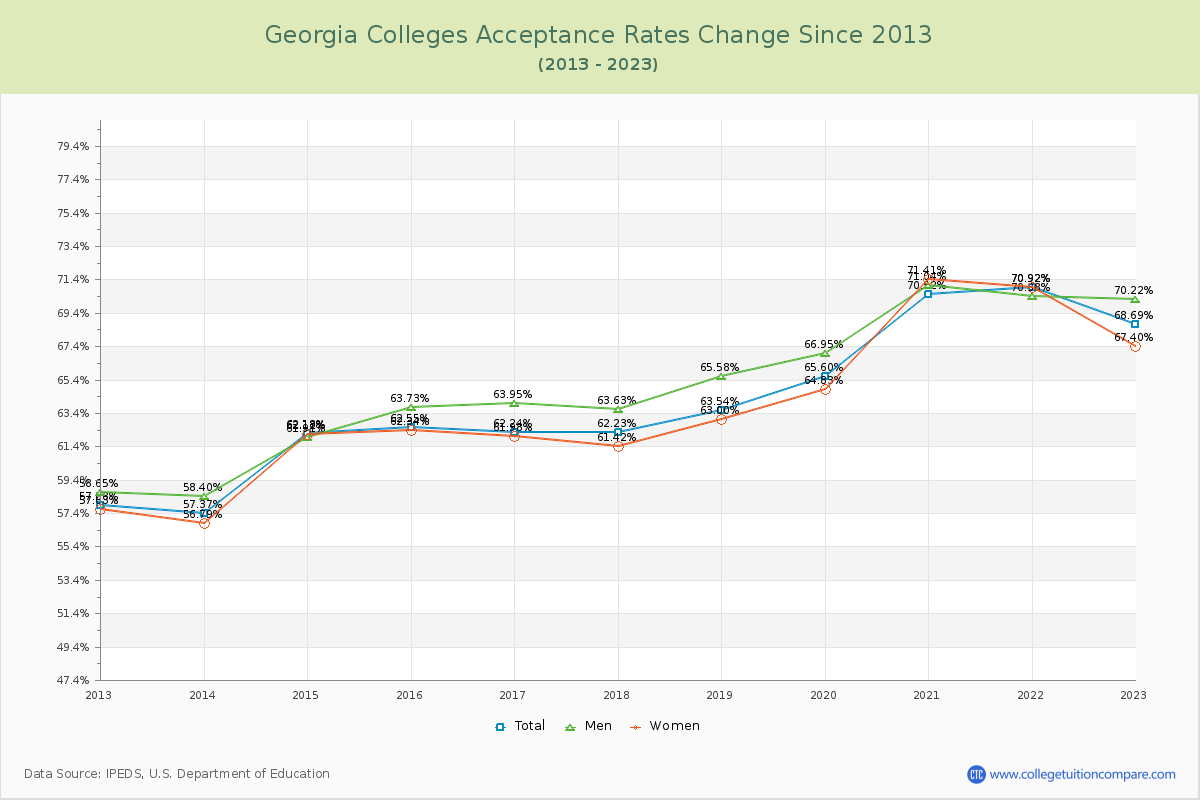
Acceptance Rate Changes
The average acceptance rate over the last 10 years is 63.97% where the current academic year rate is 68.69% at Georgia Colleges. By gender, men students' acceptance rate is 64.95% and women students' rate is 63.62%. Last year, it was slightly harder to get into Georgia Colleges than the previous year. The next table and chart illustrate the acceptance rates changes at Georgia Colleges over the past 11 years (2012-2023).
| Year | Total | Men | Women |
|---|---|---|---|
| 2012-13 | 57.88% | 58.65% | 57.63% |
| 2013-14 | 57.37% -0.51% |
58.40% -0.84% |
56.79% -0.84% |
| 2014-15 | 62.18% 4.81% |
61.91% 5.33% |
62.12% 5.33% |
| 2015-16 | 62.55% 0.36% |
63.73% 0.22% |
62.34% 0.22% |
| 2016-17 | 62.24% -0.31% |
63.95% -0.36% |
61.98% -0.36% |
| 2017-18 | 62.23% -0.01% |
63.63% -0.57% |
61.42% -0.57% |
| 2018-19 | 63.54% 1.31% |
65.58% 1.58% |
63.00% 1.58% |
| 2019-20 | 65.60% 2.07% |
66.95% 1.83% |
64.83% 1.83% |
| 2020-21 | 70.52% 4.91% |
71.04% 6.57% |
71.41% 6.57% |
| 2021-22 | 70.92% 0.40% |
70.38% -0.48% |
70.92% -0.48% |
| 2022-23 | 68.69% -2.23% |
70.22% -3.52% |
67.40% -3.52% |
| Average | 63.97% | 64.95% | 63.62% |