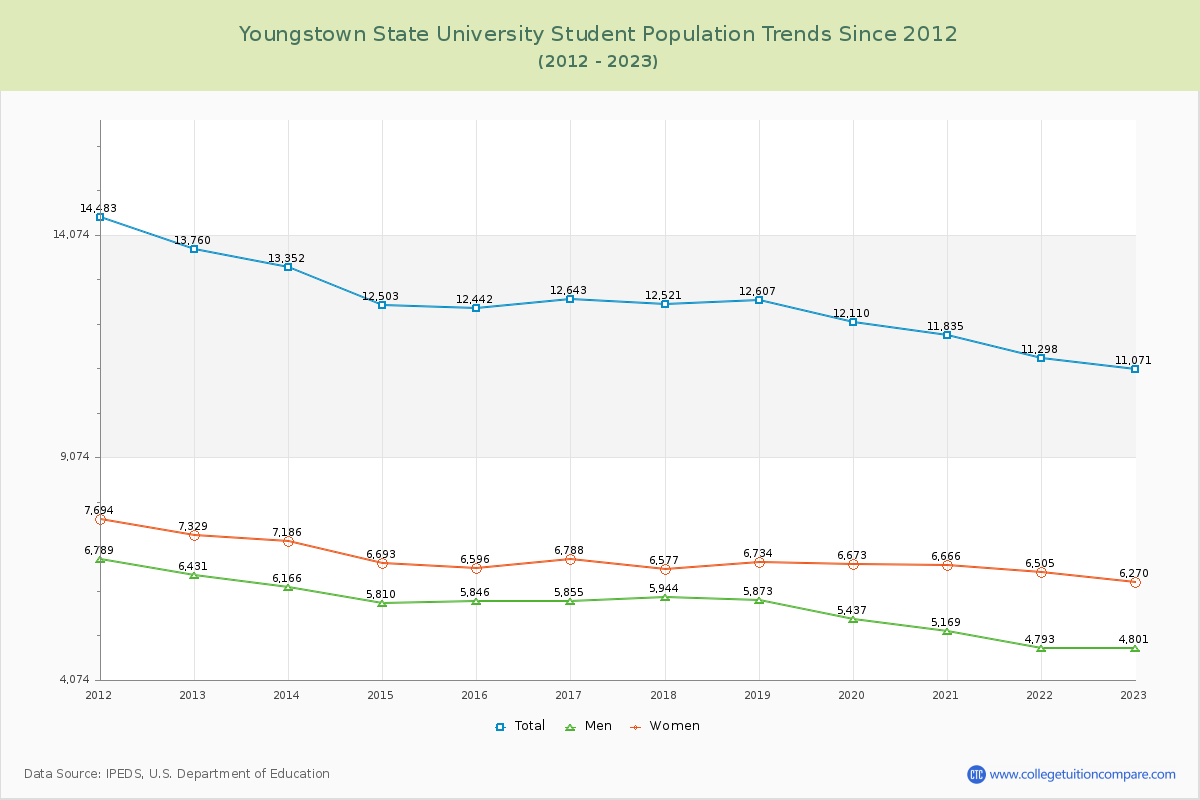
Student Population Changes
The average student population over the last 12 years is 12,377 where 11,071 students are attending the school for the academic year 2022-2023.
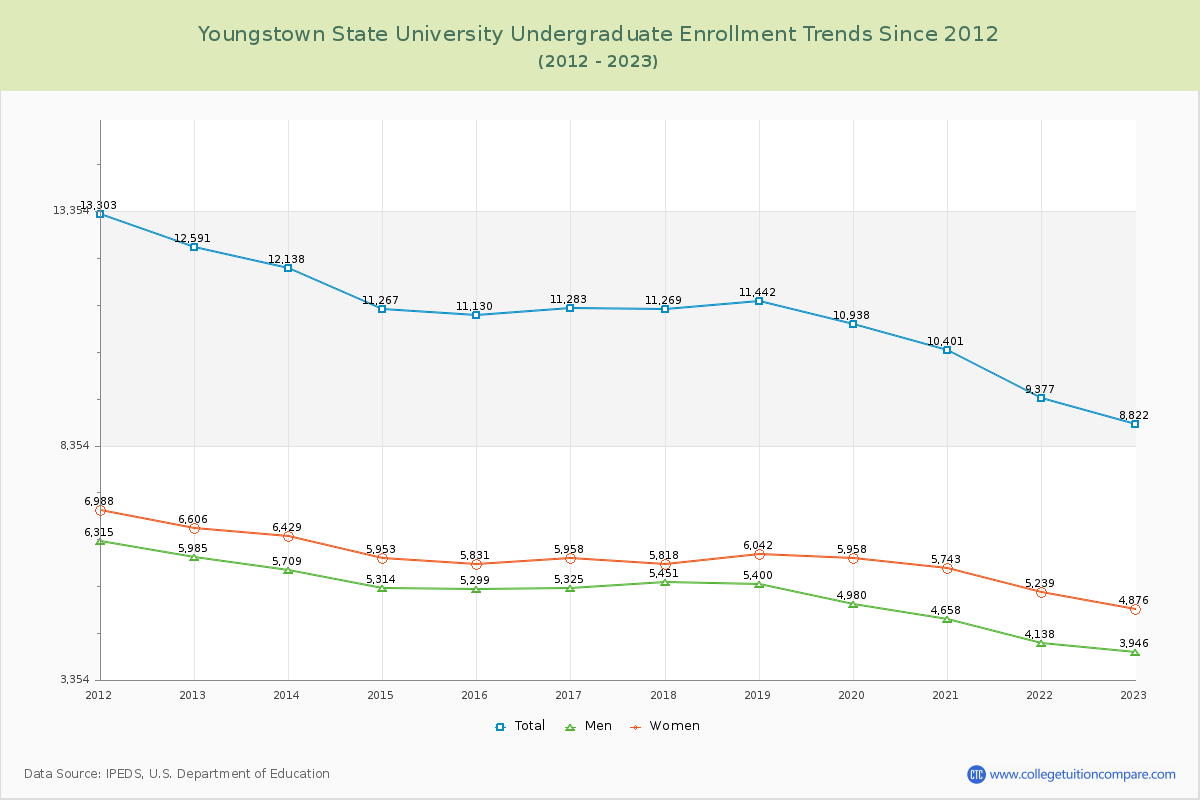
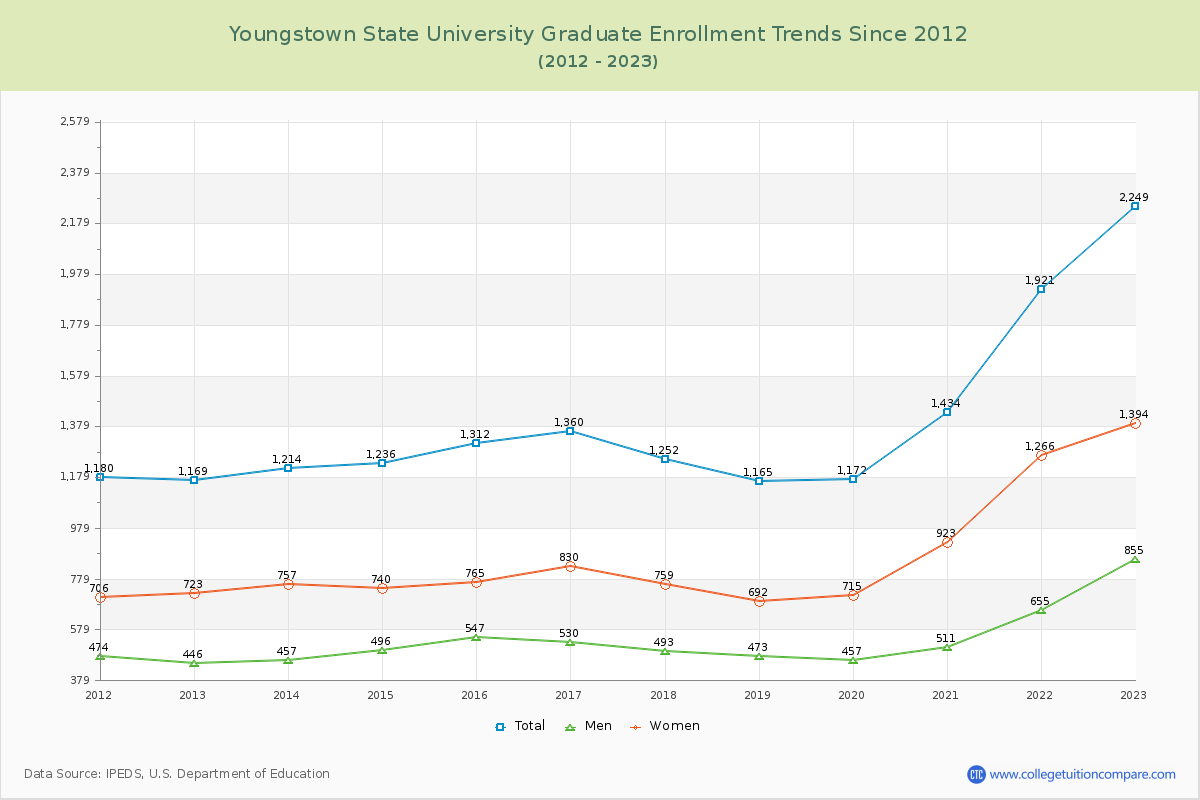
79.69% of total students is undergraduate students and 20.31% students is graduate students. The number of undergraduate students has decreased by 3,769 and the graduate enrollment has increased by 1,080 over past 10 years.
The female to male ratio is 1.31 to 1 and it means that there are more female students enrolled in Youngstown State than male students.
The following table and chart illustrate the changes in student population by gender at Youngstown State University since 2012.
| Year | Total | Undergraduate | Graduate | ||||
|---|---|---|---|---|---|---|---|
| Total | Men | Women | Total | Men | Women | ||
| 2012-13 | 13,760 | 12,591 | 5,985 | 6,606 | 1,169 | 446 | 723 |
| 2013-14 | 13,352 -408 | 12,138 -453 | 5,709 -276 | 6,429 -177 | 1,214 45 | 457 11 | 757 34 |
| 2014-15 | 12,503 -849 | 11,267 -871 | 5,314 -395 | 5,953 -476 | 1,236 22 | 496 39 | 740 -17 |
| 2015-16 | 12,442 -61 | 11,130 -137 | 5,299 -15 | 5,831 -122 | 1,312 76 | 547 51 | 765 25 |
| 2016-17 | 12,643 201 | 11,283 153 | 5,325 26 | 5,958 127 | 1,360 48 | 530 -17 | 830 65 |
| 2017-18 | 12,521 -122 | 11,269 -14 | 5,451 126 | 5,818 -140 | 1,252 -108 | 493 -37 | 759 -71 |
| 2018-19 | 12,607 86 | 11,442 173 | 5,400 -51 | 6,042 224 | 1,165 -87 | 473 -20 | 692 -67 |
| 2019-20 | 12,110 -497 | 10,938 -504 | 4,980 -420 | 5,958 -84 | 1,172 7 | 457 -16 | 715 23 |
| 2020-21 | 11,835 -275 | 10,401 -537 | 4,658 -322 | 5,743 -215 | 1,434 262 | 511 54 | 923 208 |
| 2021-22 | 11,298 -537 | 9,377 -1,024 | 4,138 -520 | 5,239 -504 | 1,921 487 | 655 144 | 1,266 343 |
| 2022-23 | 11,071 -227 | 8,822 -555 | 3,946 -192 | 4,876 -363 | 2,249 328 | 855 200 | 1,394 128 |
| Average | 12,377 | 10,969 | 5,110 | 5,859 | 1,408 | 538 | 869 |