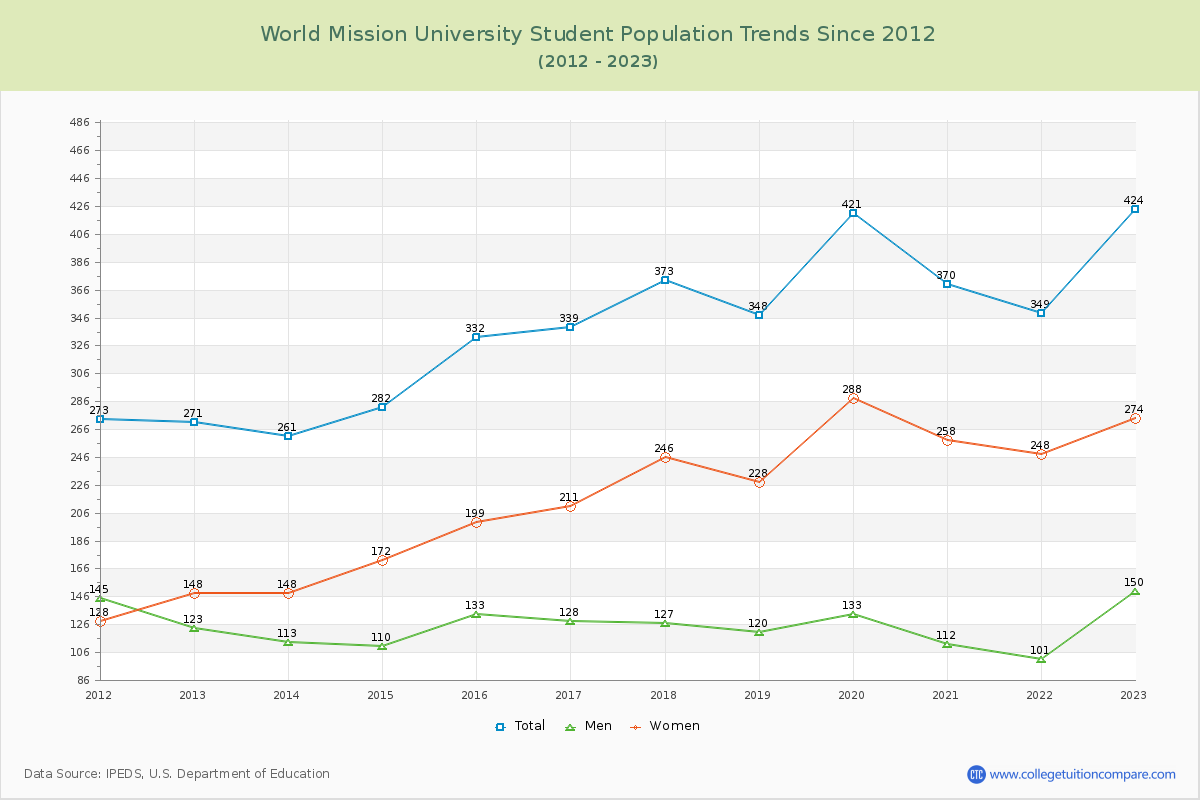
Student Population Changes
The average student population over the last 12 years is 343 where 424 students are attending the school for the academic year 2022-2023.
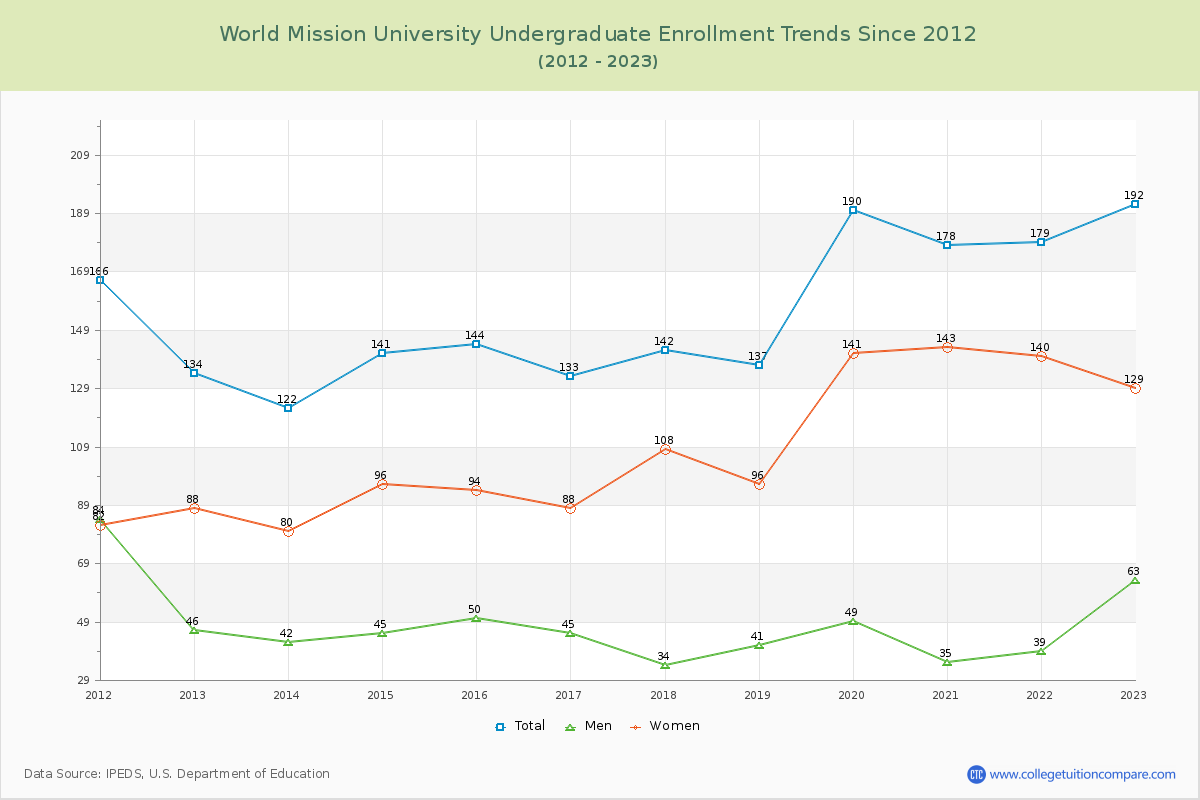
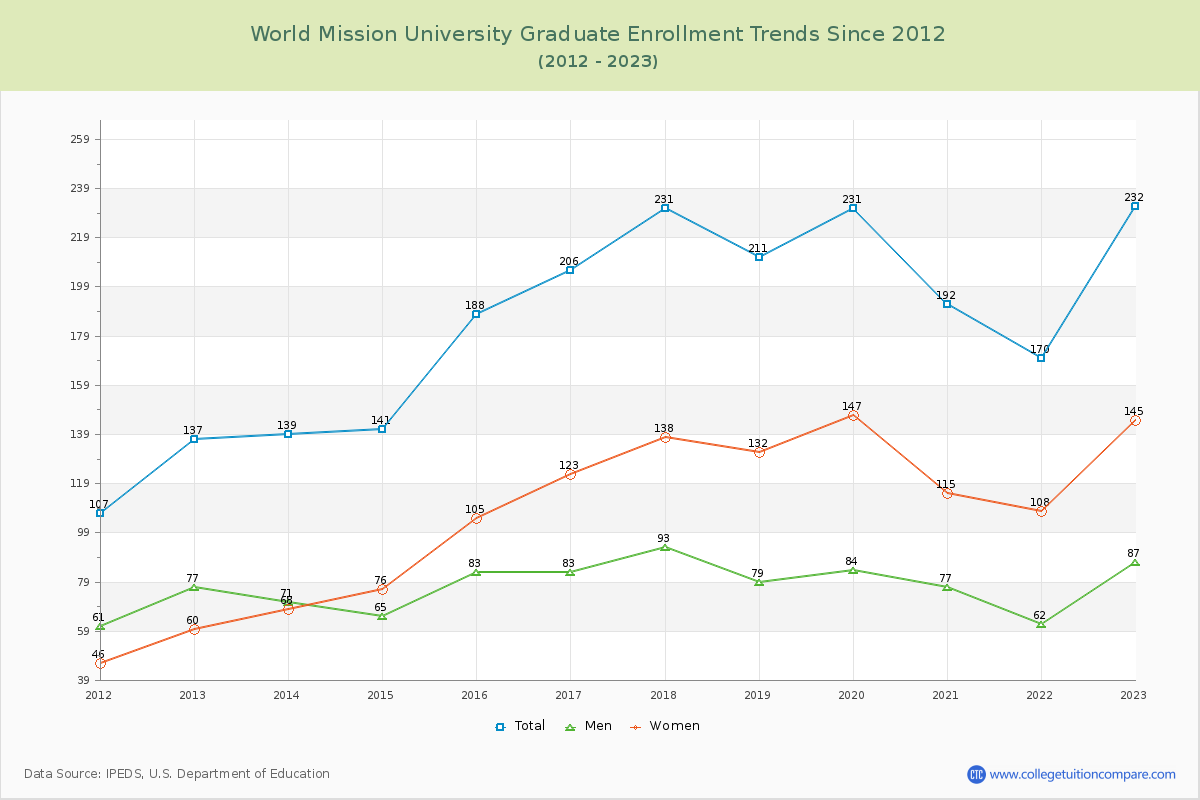
45.28% of total students is undergraduate students and 54.72% students is graduate students. The number of undergraduate students has increased by 58 and the graduate enrollment has increased by 95 over past 10 years.
The female to male ratio is 1.83 to 1 and it means that there are more female students enrolled in World Mission than male students.
The following table and chart illustrate the changes in student population by gender at World Mission University since 2012.
| Year | Total | Undergraduate | Graduate | ||||
|---|---|---|---|---|---|---|---|
| Total | Men | Women | Total | Men | Women | ||
| 2012-13 | 271 | 134 | 46 | 88 | 137 | 77 | 60 |
| 2013-14 | 261 -10 | 122 -12 | 42 -4 | 80 -8 | 139 2 | 71 -6 | 68 8 |
| 2014-15 | 282 21 | 141 19 | 45 3 | 96 16 | 141 2 | 65 -6 | 76 8 |
| 2015-16 | 332 50 | 144 3 | 50 5 | 94 -2 | 188 47 | 83 18 | 105 29 |
| 2016-17 | 339 7 | 133 -11 | 45 -5 | 88 -6 | 206 18 | 83 0 | 123 18 |
| 2017-18 | 373 34 | 142 9 | 34 -11 | 108 20 | 231 25 | 93 10 | 138 15 |
| 2018-19 | 348 -25 | 137 -5 | 41 7 | 96 -12 | 211 -20 | 79 -14 | 132 -6 |
| 2019-20 | 421 73 | 190 53 | 49 8 | 141 45 | 231 20 | 84 5 | 147 15 |
| 2020-21 | 370 -51 | 178 -12 | 35 -14 | 143 2 | 192 -39 | 77 -7 | 115 -32 |
| 2021-22 | 349 -21 | 179 1 | 39 4 | 140 -3 | 170 -22 | 62 -15 | 108 -7 |
| 2022-23 | 424 75 | 192 13 | 63 24 | 129 -11 | 232 62 | 87 25 | 145 37 |
| Average | 343 | 154 | 44 | 109 | 189 | 78 | 111 |