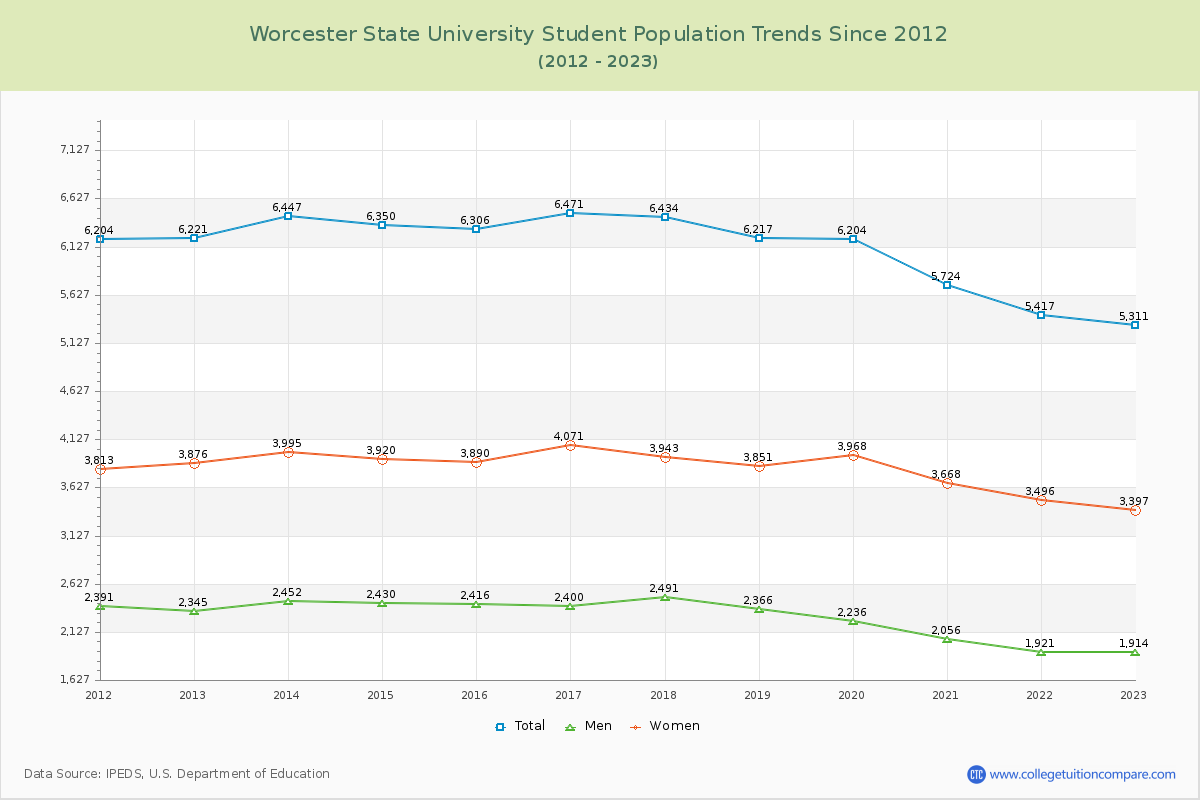
Student Population Changes
The average student population over the last 12 years is 6,100 where 5,311 students are attending the school for the academic year 2022-2023.
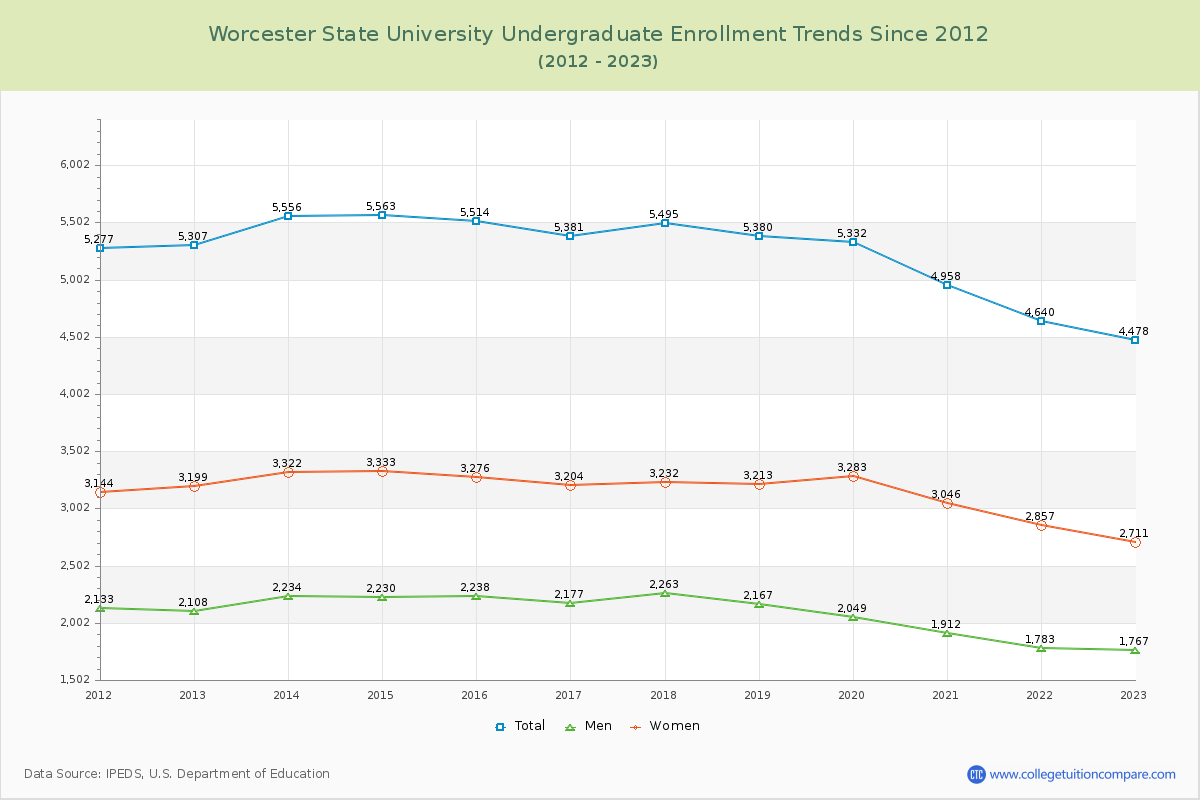
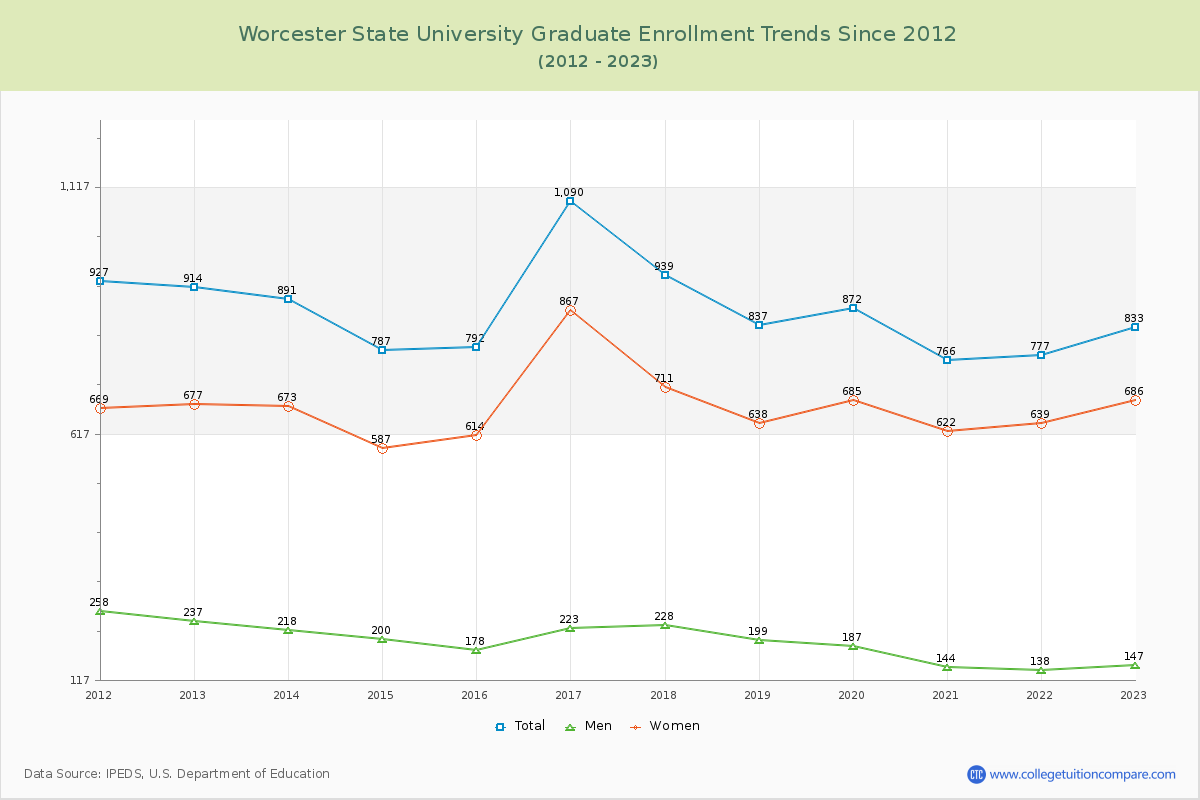
84.32% of total students is undergraduate students and 15.68% students is graduate students. The number of undergraduate students has decreased by 829 and the graduate enrollment has decreased by 81 over past 10 years.
The female to male ratio is 1.77 to 1 and it means that there are more female students enrolled in Worcester State than male students.
The following table and chart illustrate the changes in student population by gender at Worcester State University since 2012.
| Year | Total | Undergraduate | Graduate | ||||
|---|---|---|---|---|---|---|---|
| Total | Men | Women | Total | Men | Women | ||
| 2012-13 | 6,221 | 5,307 | 2,108 | 3,199 | 914 | 237 | 677 |
| 2013-14 | 6,447 226 | 5,556 249 | 2,234 126 | 3,322 123 | 891 -23 | 218 -19 | 673 -4 |
| 2014-15 | 6,350 -97 | 5,563 7 | 2,230 -4 | 3,333 11 | 787 -104 | 200 -18 | 587 -86 |
| 2015-16 | 6,306 -44 | 5,514 -49 | 2,238 8 | 3,276 -57 | 792 5 | 178 -22 | 614 27 |
| 2016-17 | 6,471 165 | 5,381 -133 | 2,177 -61 | 3,204 -72 | 1,090 298 | 223 45 | 867 253 |
| 2017-18 | 6,434 -37 | 5,495 114 | 2,263 86 | 3,232 28 | 939 -151 | 228 5 | 711 -156 |
| 2018-19 | 6,217 -217 | 5,380 -115 | 2,167 -96 | 3,213 -19 | 837 -102 | 199 -29 | 638 -73 |
| 2019-20 | 6,204 -13 | 5,332 -48 | 2,049 -118 | 3,283 70 | 872 35 | 187 -12 | 685 47 |
| 2020-21 | 5,724 -480 | 4,958 -374 | 1,912 -137 | 3,046 -237 | 766 -106 | 144 -43 | 622 -63 |
| 2021-22 | 5,417 -307 | 4,640 -318 | 1,783 -129 | 2,857 -189 | 777 11 | 138 -6 | 639 17 |
| 2022-23 | 5,311 -106 | 4,478 -162 | 1,767 -16 | 2,711 -146 | 833 56 | 147 9 | 686 47 |
| Average | 6,100 | 5,237 | 2,084 | 3,152 | 863 | 191 | 673 |