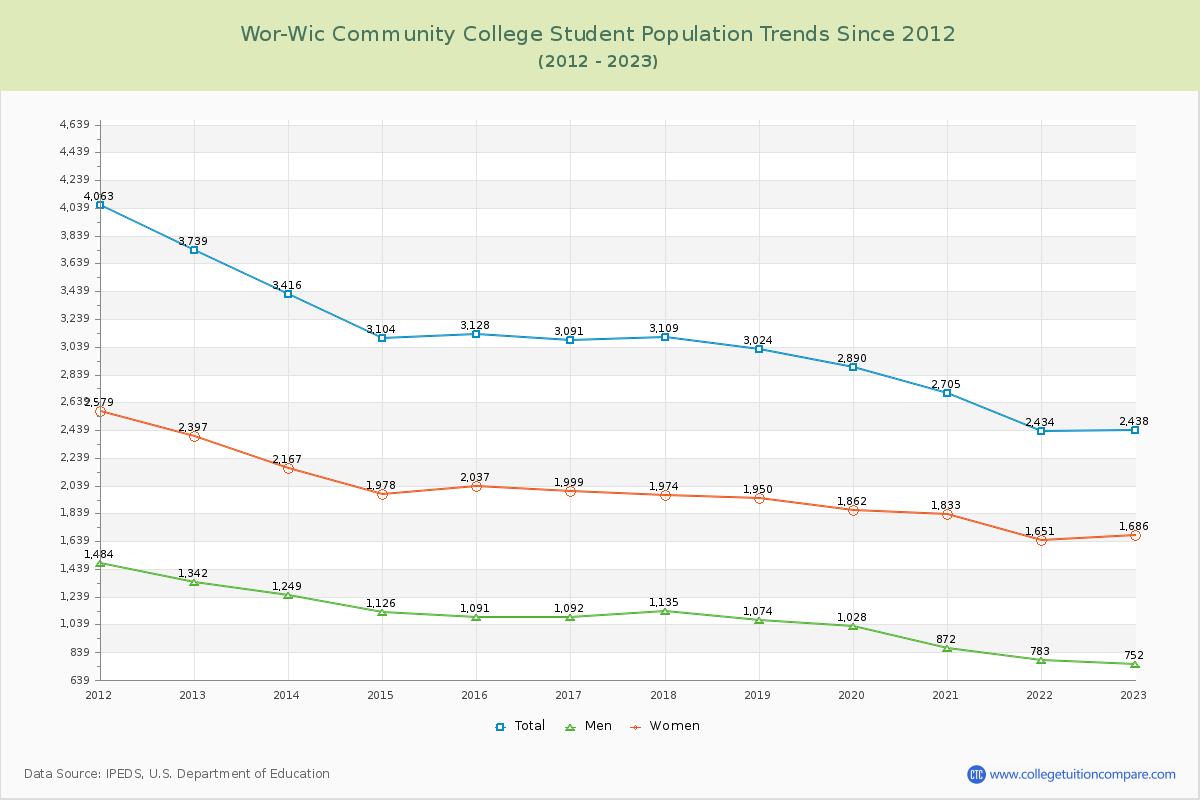
Student Population Changes
The average student population over the last 12 years is 3,007 where 2,438 students are attending the school for the academic year 2022-2023.
The female to male ratio is 2.24 to 1 and it means that there are far more female students enrolled in Wor-Wic CC than male students.
The following table and chart illustrate the changes in student population by gender at Wor-Wic Community College since 2012.
| Year | Total | Men | Women |
|---|---|---|---|
| 2012-13 | 3,739 | 1,342 | 2,397 |
| 2013-14 | 3,416 -323 | 1,249 -93 | 2,167 -230 |
| 2014-15 | 3,104 -312 | 1,126 -123 | 1,978 -189 |
| 2015-16 | 3,128 24 | 1,091 -35 | 2,037 59 |
| 2016-17 | 3,091 -37 | 1,092 1 | 1,999 -38 |
| 2017-18 | 3,109 18 | 1,135 43 | 1,974 -25 |
| 2018-19 | 3,024 -85 | 1,074 -61 | 1,950 -24 |
| 2019-20 | 2,890 -134 | 1,028 -46 | 1,862 -88 |
| 2020-21 | 2,705 -185 | 872 -156 | 1,833 -29 |
| 2021-22 | 2,434 -271 | 783 -89 | 1,651 -182 |
| 2022-23 | 2,438 4 | 752 -31 | 1,686 35 |
| Average | 3,007 | 1,049 | 1,958 |