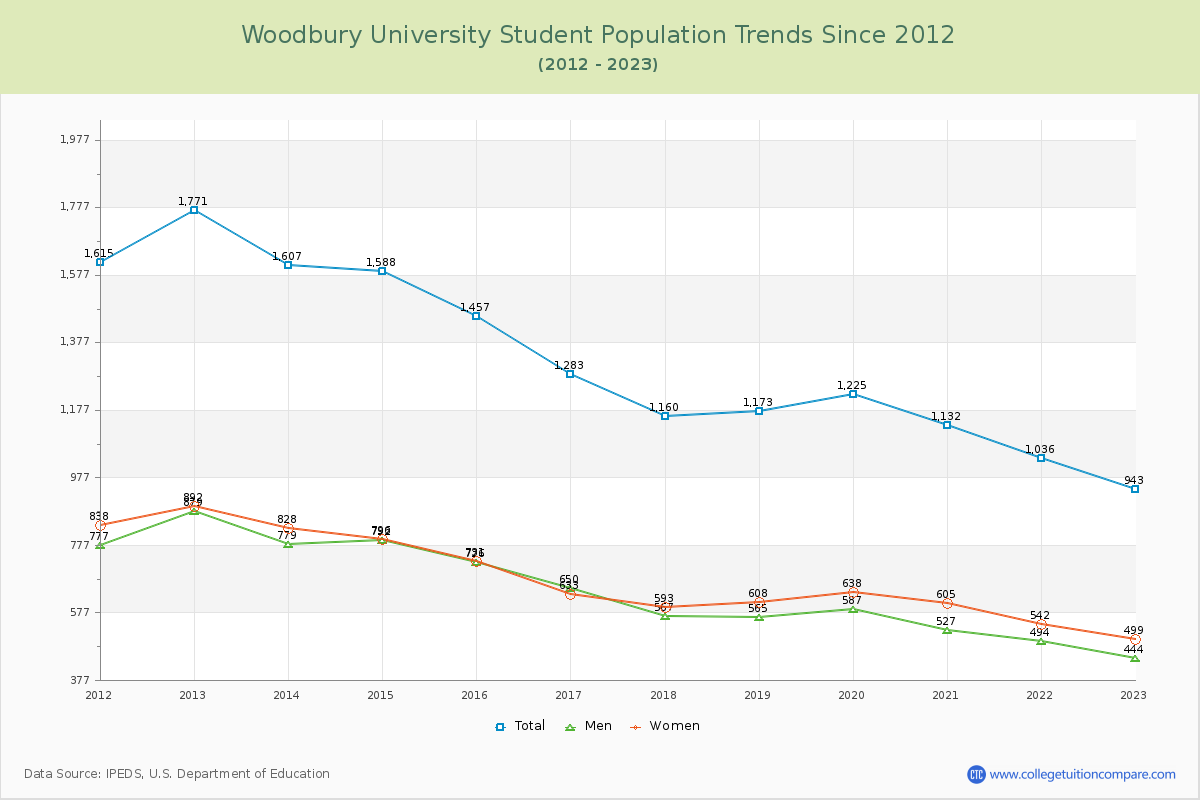
Student Population Changes
The average student population over the last 12 years is 1,307 where 943 students are attending the school for the academic year 2022-2023.
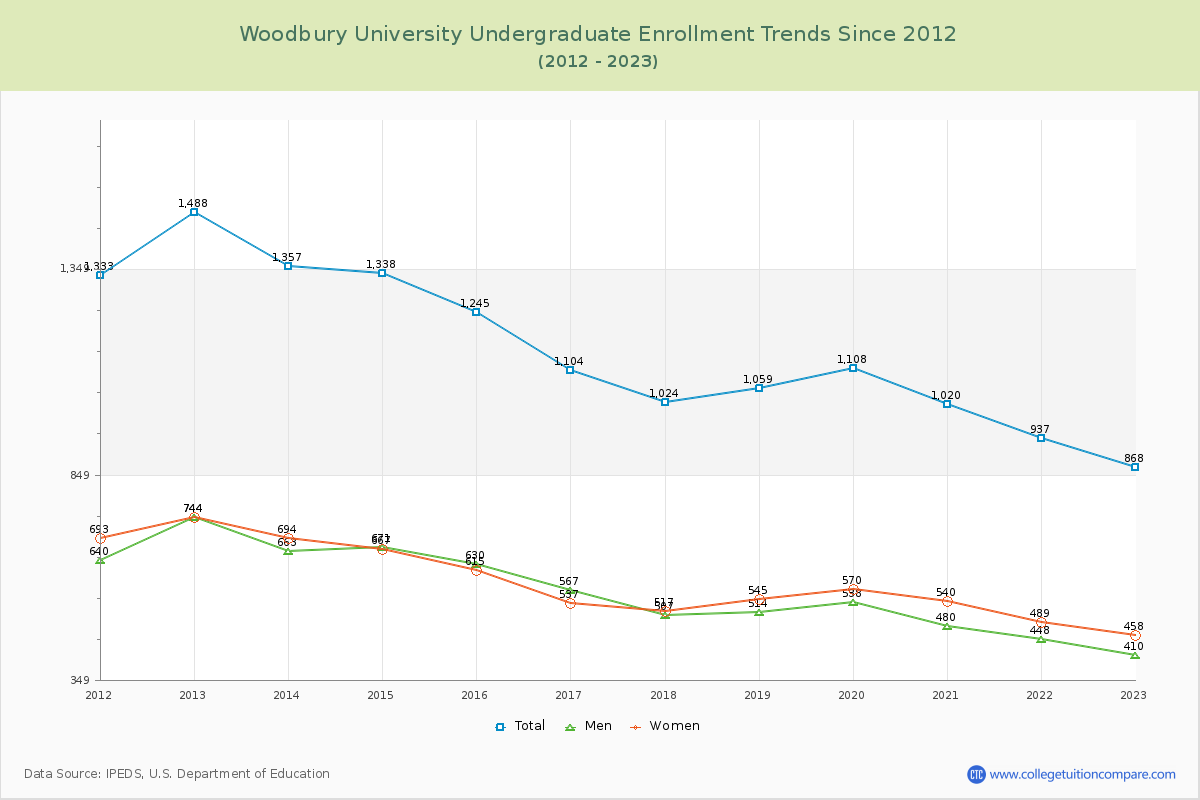
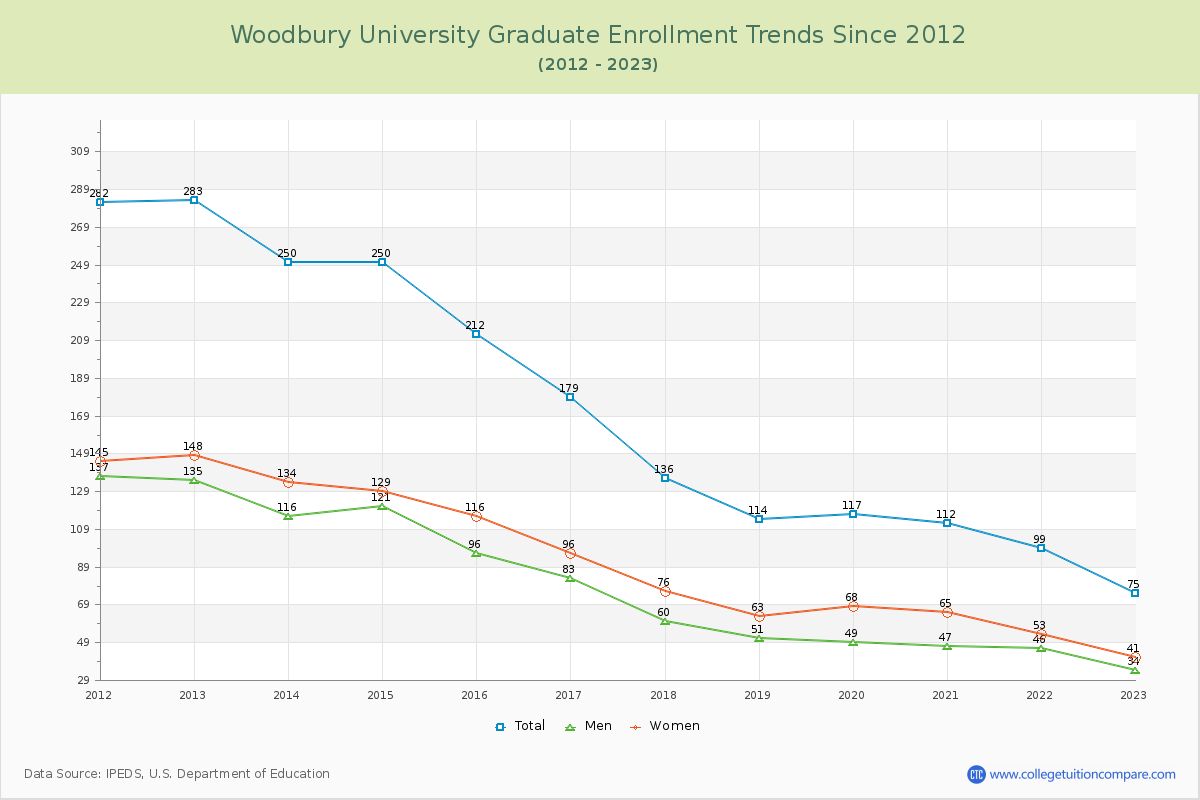
92.05% of total students is undergraduate students and 7.95% students is graduate students. The number of undergraduate students has decreased by 620 and the graduate enrollment has decreased by 208 over past 10 years.
The female to male ratio is 1.12 to 1 and it means that there are slightly more female students enrolled in Woodbury than male students.
The following table and chart illustrate the changes in student population by gender at Woodbury University since 2012.
| Year | Total | Undergraduate | Graduate | ||||
|---|---|---|---|---|---|---|---|
| Total | Men | Women | Total | Men | Women | ||
| 2012-13 | 1,771 | 1,488 | 744 | 744 | 283 | 135 | 148 |
| 2013-14 | 1,607 -164 | 1,357 -131 | 663 -81 | 694 -50 | 250 -33 | 116 -19 | 134 -14 |
| 2014-15 | 1,588 -19 | 1,338 -19 | 671 8 | 667 -27 | 250 0 | 121 5 | 129 -5 |
| 2015-16 | 1,457 -131 | 1,245 -93 | 630 -41 | 615 -52 | 212 -38 | 96 -25 | 116 -13 |
| 2016-17 | 1,283 -174 | 1,104 -141 | 567 -63 | 537 -78 | 179 -33 | 83 -13 | 96 -20 |
| 2017-18 | 1,160 -123 | 1,024 -80 | 507 -60 | 517 -20 | 136 -43 | 60 -23 | 76 -20 |
| 2018-19 | 1,173 13 | 1,059 35 | 514 7 | 545 28 | 114 -22 | 51 -9 | 63 -13 |
| 2019-20 | 1,225 52 | 1,108 49 | 538 24 | 570 25 | 117 3 | 49 -2 | 68 5 |
| 2020-21 | 1,132 -93 | 1,020 -88 | 480 -58 | 540 -30 | 112 -5 | 47 -2 | 65 -3 |
| 2021-22 | 1,036 -96 | 937 -83 | 448 -32 | 489 -51 | 99 -13 | 46 -1 | 53 -12 |
| 2022-23 | 943 -93 | 868 -69 | 410 -38 | 458 -31 | 75 -24 | 34 -12 | 41 -12 |
| Average | 1,307 | 1,141 | 561 | 580 | 166 | 76 | 90 |