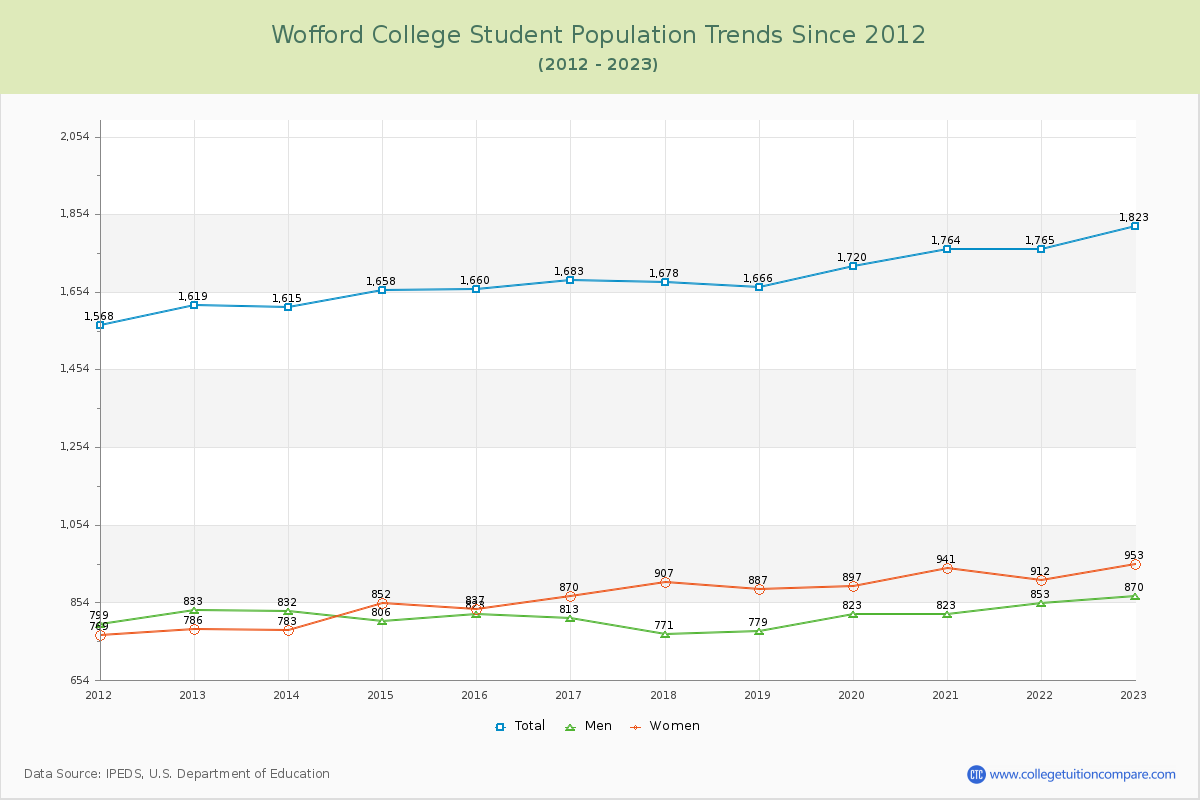
Student Population Changes
The average student population over the last 12 years is 1,696 where 1,823 students are attending the school for the academic year 2022-2023.
The female to male ratio is 1.10 to 1 and it means that there are similar numbers of female and male students enrolled in Wofford.
The following table and chart illustrate the changes in student population by gender at Wofford College since 2012.
| Year | Total | Men | Women |
|---|---|---|---|
| 2012-13 | 1,619 | 833 | 786 |
| 2013-14 | 1,615 -4 | 832 -1 | 783 -3 |
| 2014-15 | 1,658 43 | 806 -26 | 852 69 |
| 2015-16 | 1,660 2 | 823 17 | 837 -15 |
| 2016-17 | 1,683 23 | 813 -10 | 870 33 |
| 2017-18 | 1,678 -5 | 771 -42 | 907 37 |
| 2018-19 | 1,666 -12 | 779 8 | 887 -20 |
| 2019-20 | 1,720 54 | 823 44 | 897 10 |
| 2020-21 | 1,764 44 | 823 0 | 941 44 |
| 2021-22 | 1,765 1 | 853 30 | 912 -29 |
| 2022-23 | 1,823 58 | 870 17 | 953 41 |
| Average | 1,696 | 821 | 875 |