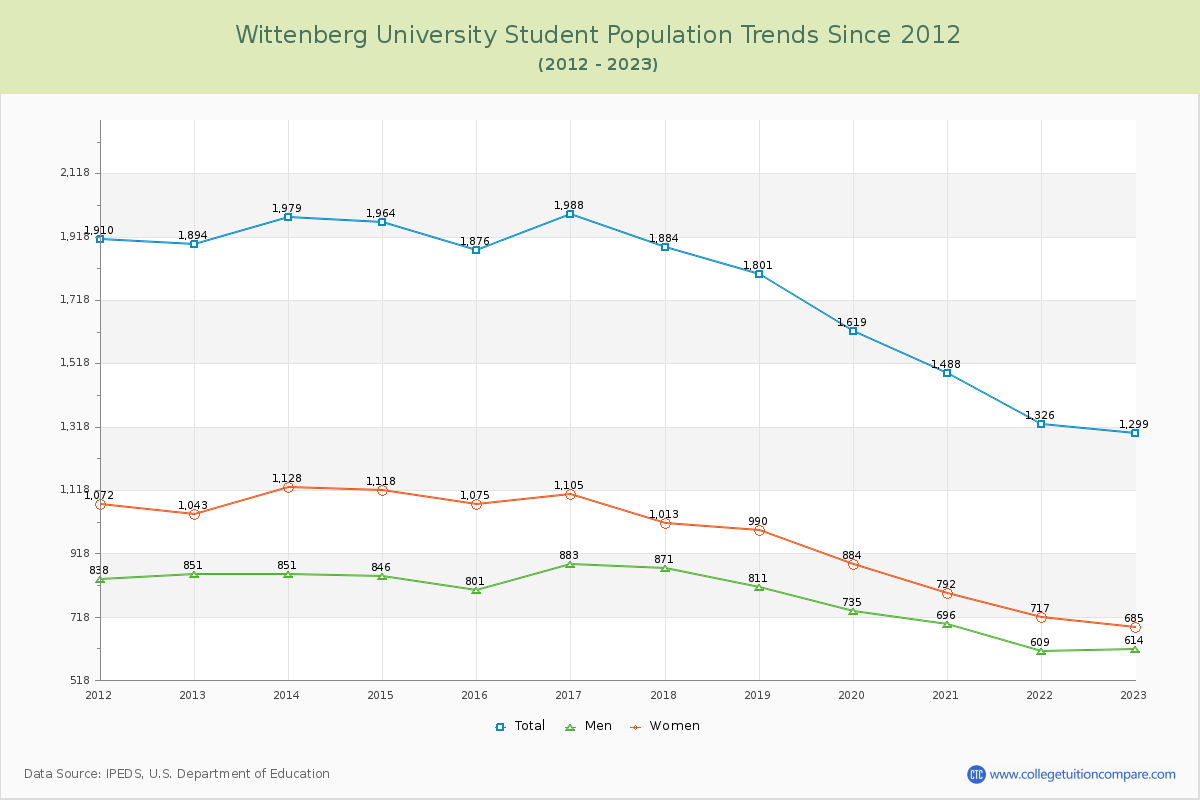
Student Population Changes
The average student population over the last 12 years is 1,738 where 1,299 students are attending the school for the academic year 2022-2023.
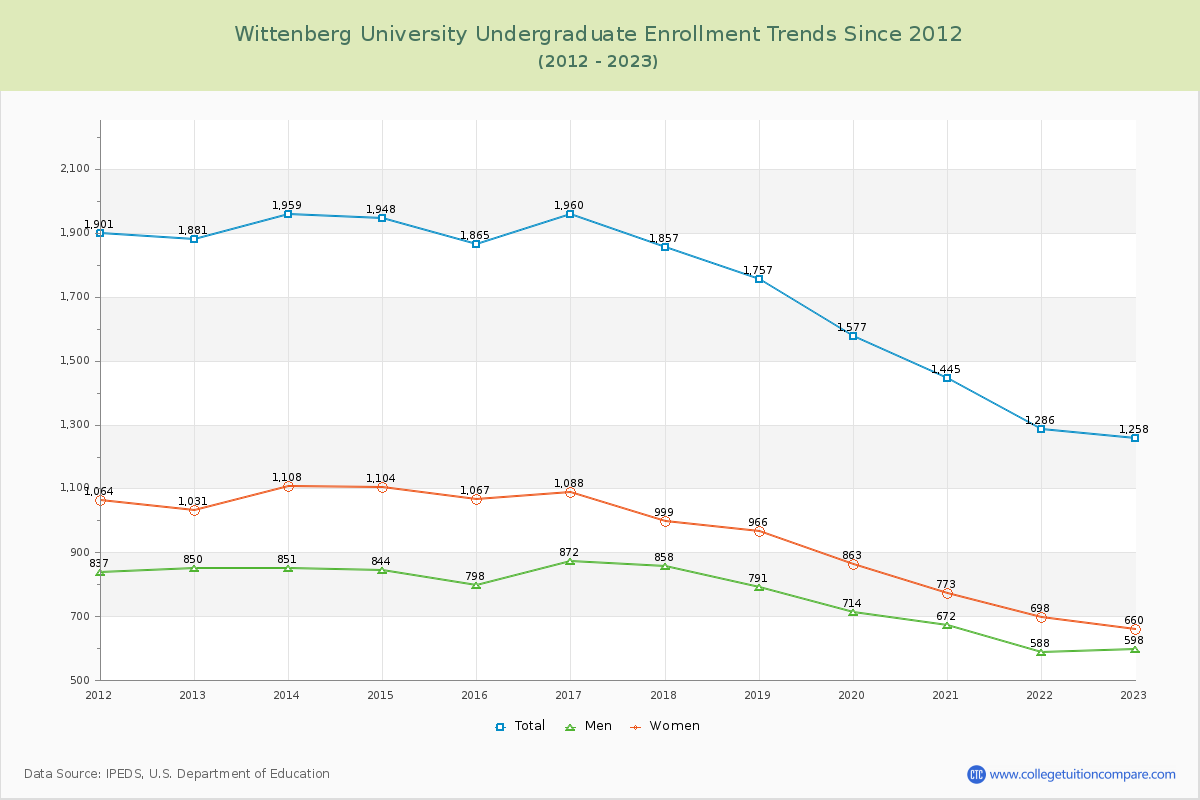
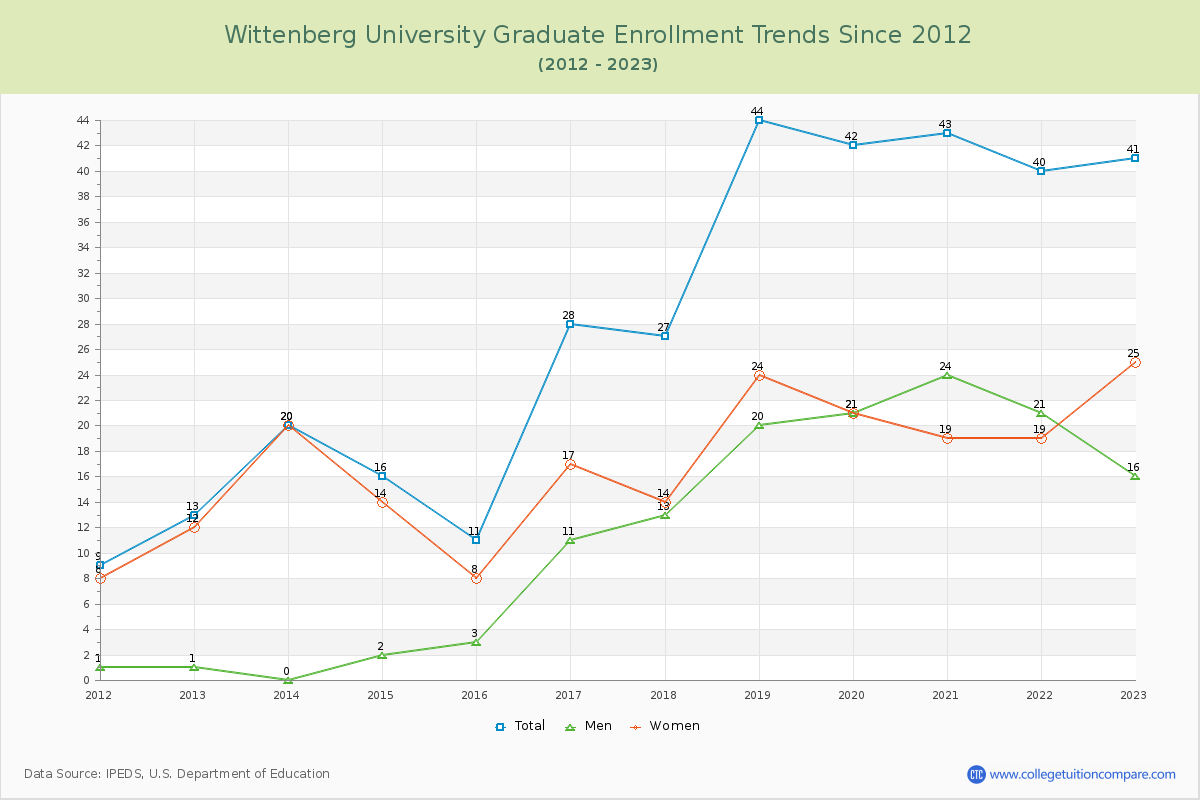
96.84% of total students is undergraduate students and 3.16% students is graduate students. The number of undergraduate students has decreased by 623 and the graduate enrollment has increased by 28 over past 10 years.
The female to male ratio is 1.12 to 1 and it means that there are slightly more female students enrolled in Wittenberg than male students.
The following table and chart illustrate the changes in student population by gender at Wittenberg University since 2012.
| Year | Total | Undergraduate | Graduate | ||||
|---|---|---|---|---|---|---|---|
| Total | Men | Women | Total | Men | Women | ||
| 2012-13 | 1,894 | 1,881 | 850 | 1,031 | 13 | 1 | 12 |
| 2013-14 | 1,979 85 | 1,959 78 | 851 1 | 1,108 77 | 20 7 | 0 -1 | 20 8 |
| 2014-15 | 1,964 -15 | 1,948 -11 | 844 -7 | 1,104 -4 | 16 -4 | 2 2 | 14 -6 |
| 2015-16 | 1,876 -88 | 1,865 -83 | 798 -46 | 1,067 -37 | 11 -5 | 3 1 | 8 -6 |
| 2016-17 | 1,988 112 | 1,960 95 | 872 74 | 1,088 21 | 28 17 | 11 8 | 17 9 |
| 2017-18 | 1,884 -104 | 1,857 -103 | 858 -14 | 999 -89 | 27 -1 | 13 2 | 14 -3 |
| 2018-19 | 1,801 -83 | 1,757 -100 | 791 -67 | 966 -33 | 44 17 | 20 7 | 24 10 |
| 2019-20 | 1,619 -182 | 1,577 -180 | 714 -77 | 863 -103 | 42 -2 | 21 1 | 21 -3 |
| 2020-21 | 1,488 -131 | 1,445 -132 | 672 -42 | 773 -90 | 43 1 | 24 3 | 19 -2 |
| 2021-22 | 1,326 -162 | 1,286 -159 | 588 -84 | 698 -75 | 40 -3 | 21 -3 | 19 0 |
| 2022-23 | 1,299 -27 | 1,258 -28 | 598 10 | 660 -38 | 41 1 | 16 -5 | 25 6 |
| Average | 1,738 | 1,708 | 767 | 942 | 30 | 12 | 18 |