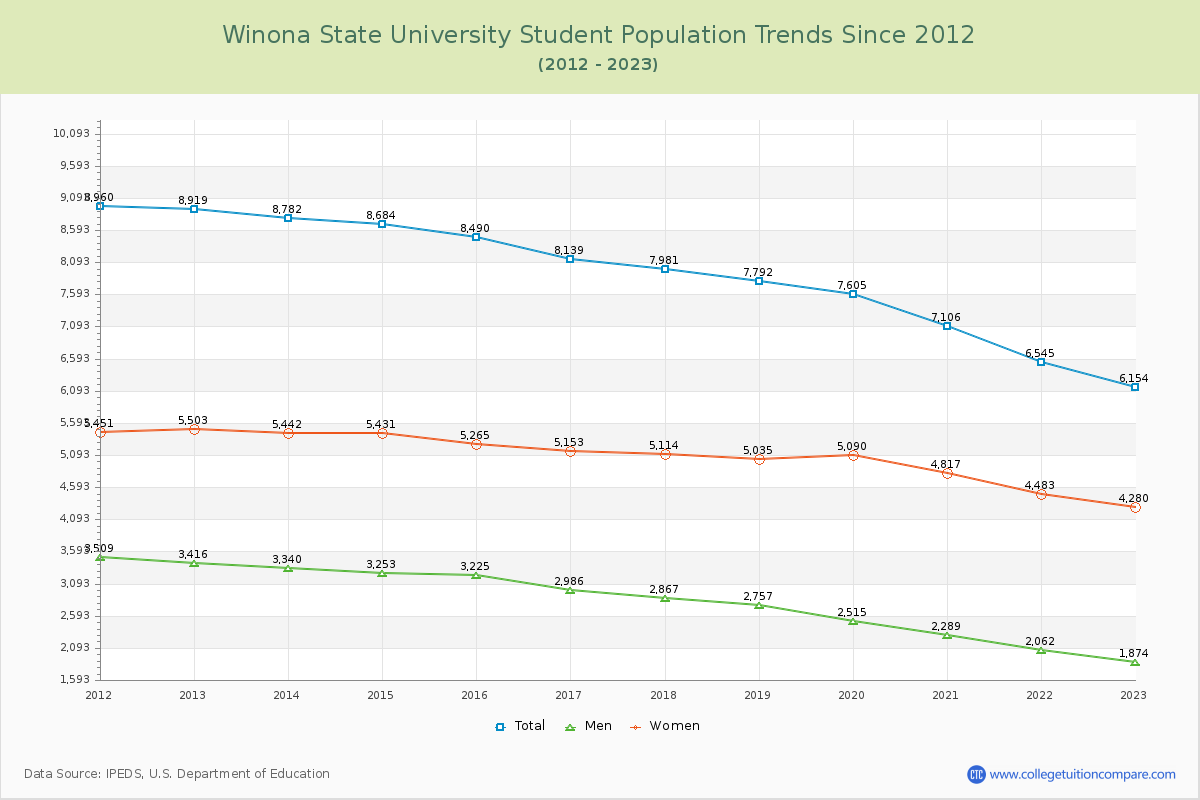
Student Population Changes
The average student population over the last 12 years is 7,836 where 6,154 students are attending the school for the academic year 2022-2023.
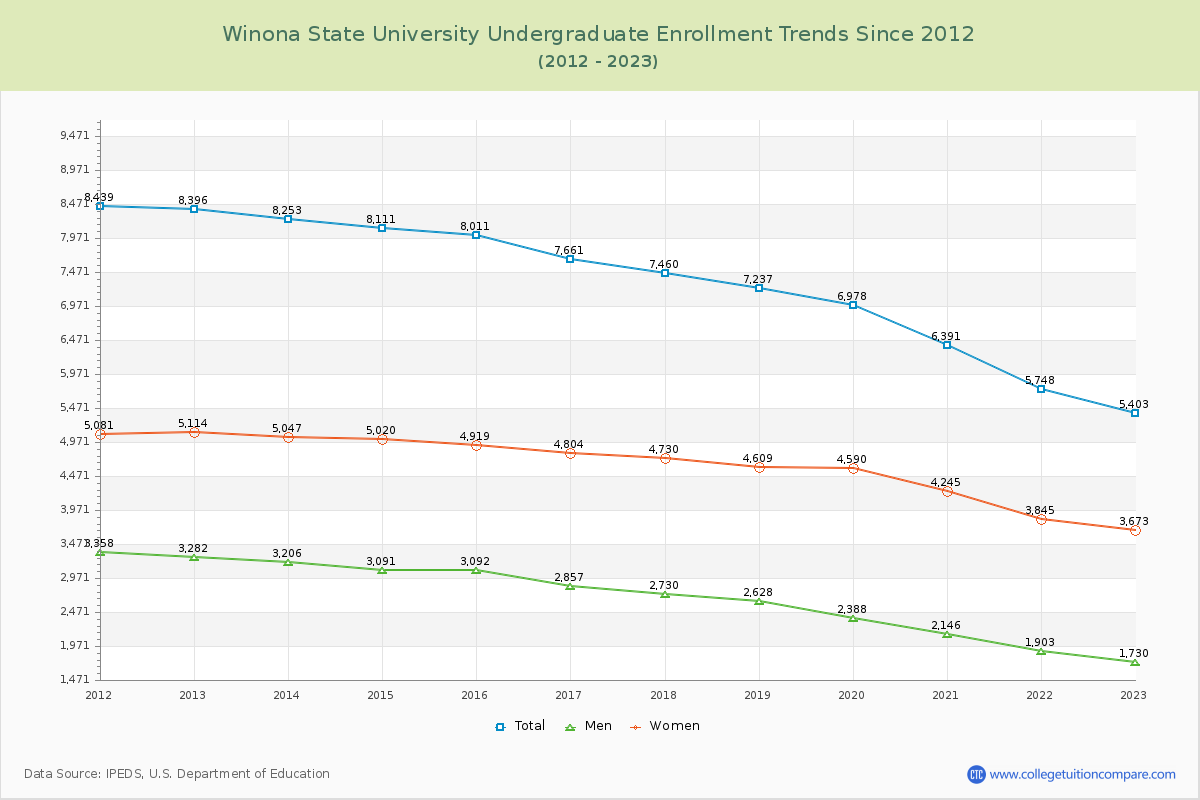
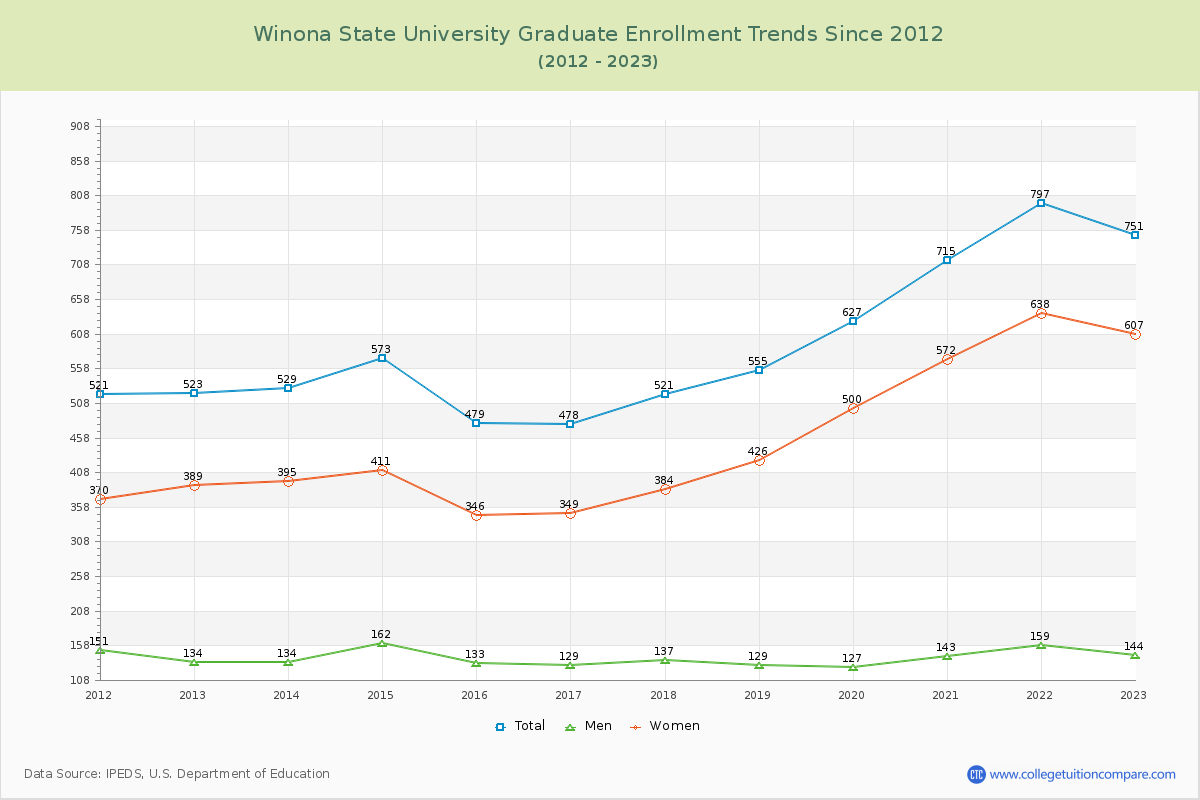
87.80% of total students is undergraduate students and 12.20% students is graduate students. The number of undergraduate students has decreased by 2,993 and the graduate enrollment has increased by 228 over past 10 years.
The female to male ratio is 2.28 to 1 and it means that there are far more female students enrolled in Winona State than male students.
The following table and chart illustrate the changes in student population by gender at Winona State University since 2012.
| Year | Total | Undergraduate | Graduate | ||||
|---|---|---|---|---|---|---|---|
| Total | Men | Women | Total | Men | Women | ||
| 2012-13 | 8,919 | 8,396 | 3,282 | 5,114 | 523 | 134 | 389 |
| 2013-14 | 8,782 -137 | 8,253 -143 | 3,206 -76 | 5,047 -67 | 529 6 | 134 0 | 395 6 |
| 2014-15 | 8,684 -98 | 8,111 -142 | 3,091 -115 | 5,020 -27 | 573 44 | 162 28 | 411 16 |
| 2015-16 | 8,490 -194 | 8,011 -100 | 3,092 1 | 4,919 -101 | 479 -94 | 133 -29 | 346 -65 |
| 2016-17 | 8,139 -351 | 7,661 -350 | 2,857 -235 | 4,804 -115 | 478 -1 | 129 -4 | 349 3 |
| 2017-18 | 7,981 -158 | 7,460 -201 | 2,730 -127 | 4,730 -74 | 521 43 | 137 8 | 384 35 |
| 2018-19 | 7,792 -189 | 7,237 -223 | 2,628 -102 | 4,609 -121 | 555 34 | 129 -8 | 426 42 |
| 2019-20 | 7,605 -187 | 6,978 -259 | 2,388 -240 | 4,590 -19 | 627 72 | 127 -2 | 500 74 |
| 2020-21 | 7,106 -499 | 6,391 -587 | 2,146 -242 | 4,245 -345 | 715 88 | 143 16 | 572 72 |
| 2021-22 | 6,545 -561 | 5,748 -643 | 1,903 -243 | 3,845 -400 | 797 82 | 159 16 | 638 66 |
| 2022-23 | 6,154 -391 | 5,403 -345 | 1,730 -173 | 3,673 -172 | 751 -46 | 144 -15 | 607 -31 |
| Average | 7,836 | 7,241 | 2,641 | 4,600 | 595 | 139 | 456 |