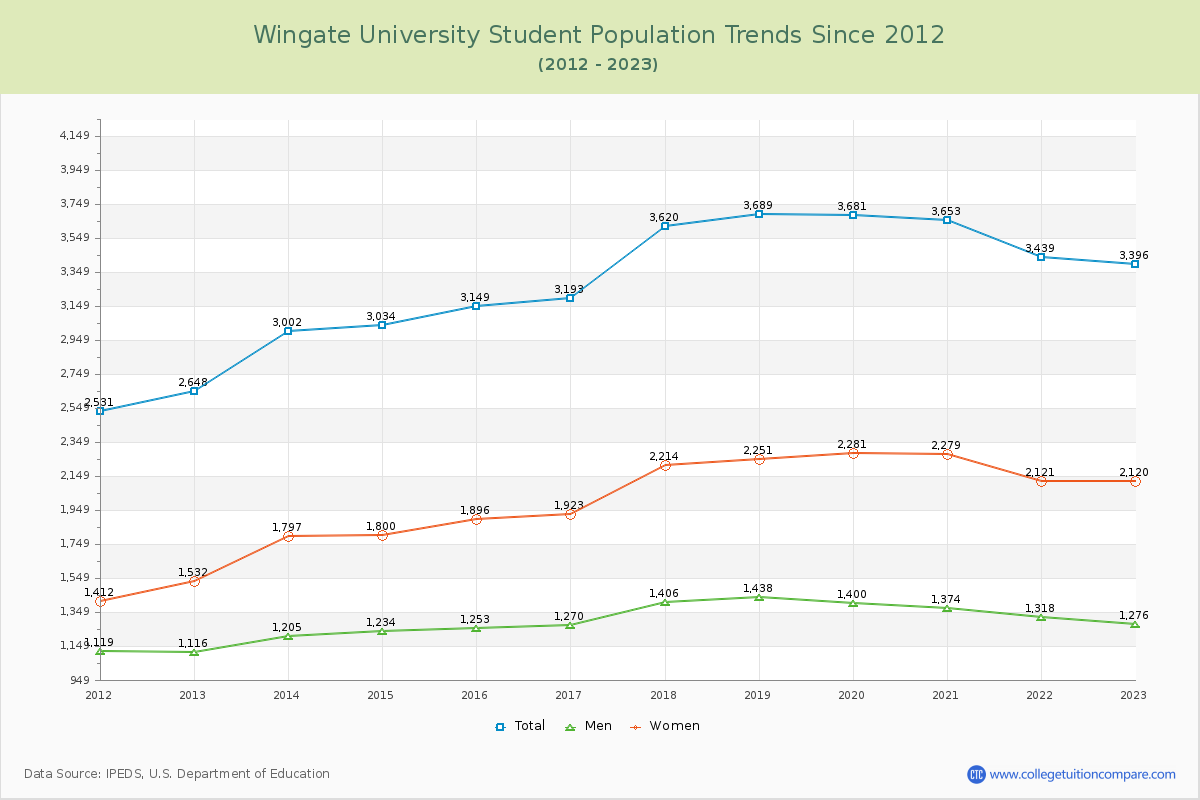
Student Population Changes
The average student population over the last 12 years is 3,319 where 3,396 students are attending the school for the academic year 2022-2023.
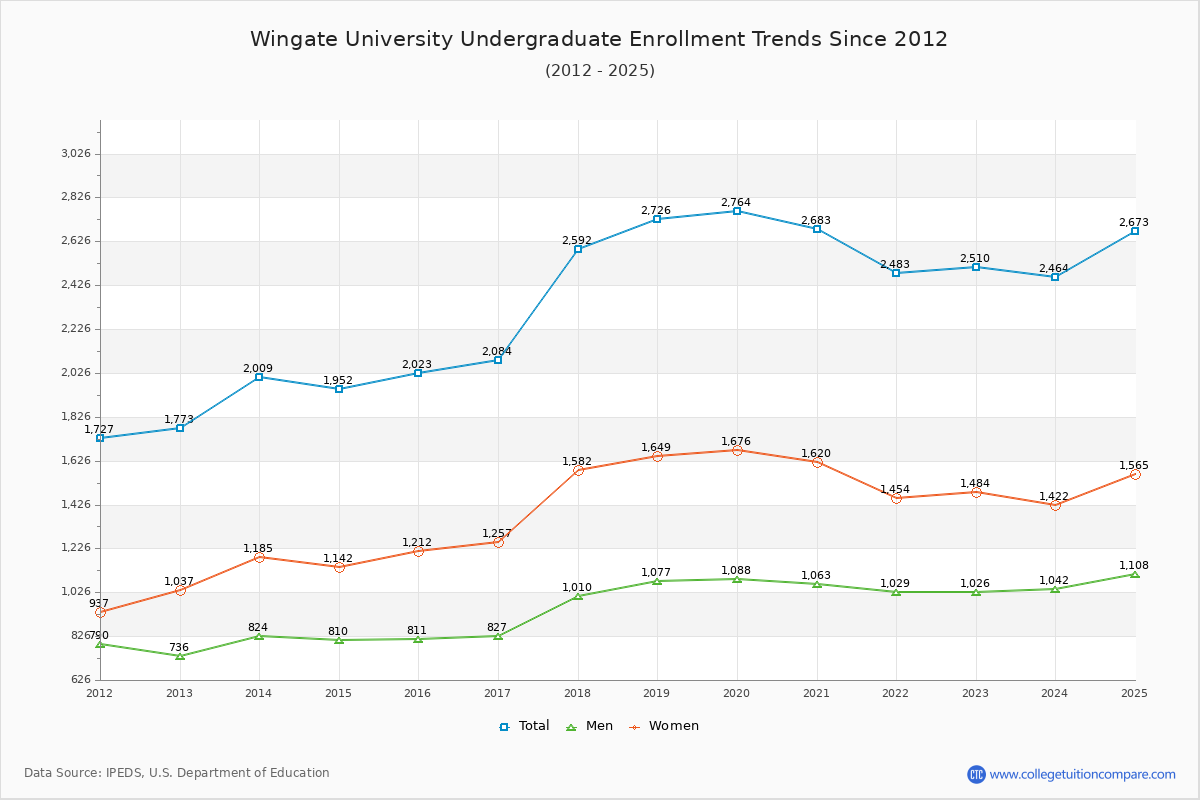
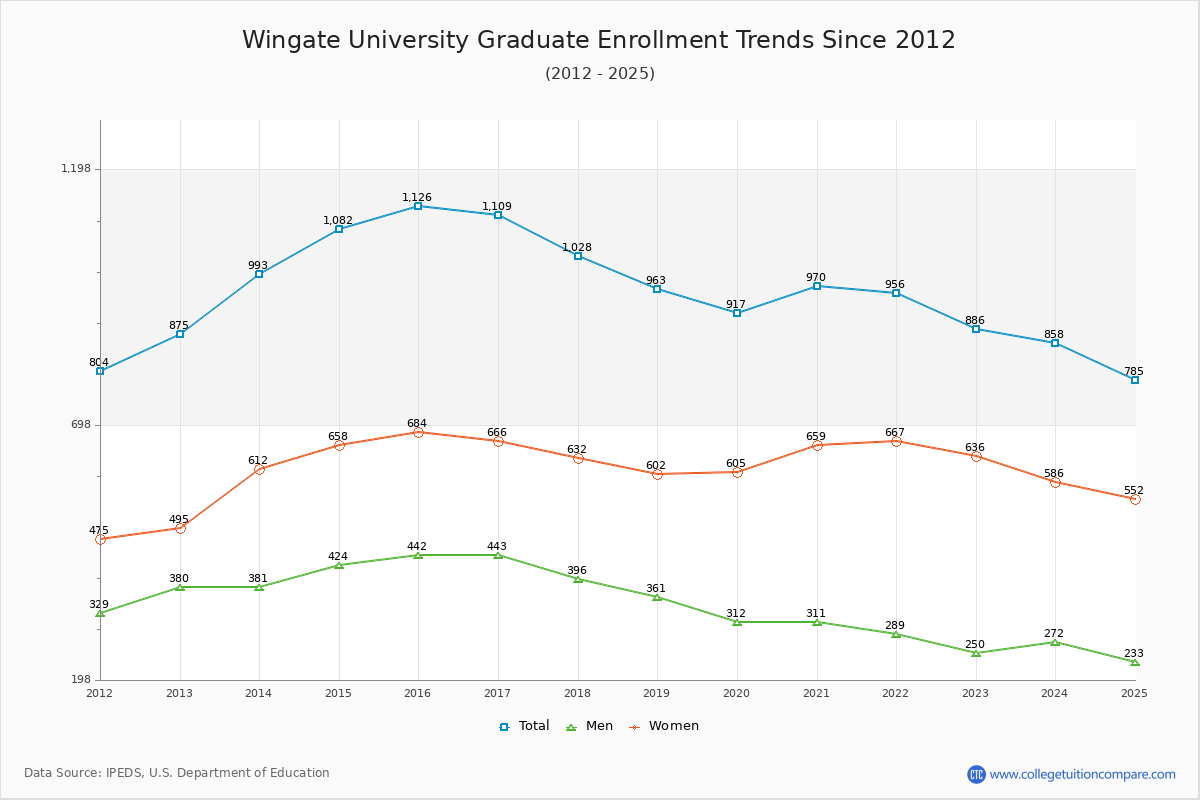
73.91% of total students is undergraduate students and 26.09% students is graduate students. The number of undergraduate students has increased by 737 and the graduate enrollment has increased by 11 over past 10 years.
The female to male ratio is 1.66 to 1 and it means that there are more female students enrolled in Wingate than male students.
The following table and chart illustrate the changes in student population by gender at Wingate University since 2012.
| Year | Total | Undergraduate | Graduate | ||||
|---|---|---|---|---|---|---|---|
| Total | Men | Women | Total | Men | Women | ||
| 2012-13 | 2,648 | 1,773 | 736 | 1,037 | 875 | 380 | 495 |
| 2013-14 | 3,002 354 | 2,009 236 | 824 88 | 1,185 148 | 993 118 | 381 1 | 612 117 |
| 2014-15 | 3,034 32 | 1,952 -57 | 810 -14 | 1,142 -43 | 1,082 89 | 424 43 | 658 46 |
| 2015-16 | 3,149 115 | 2,023 71 | 811 1 | 1,212 70 | 1,126 44 | 442 18 | 684 26 |
| 2016-17 | 3,193 44 | 2,084 61 | 827 16 | 1,257 45 | 1,109 -17 | 443 1 | 666 -18 |
| 2017-18 | 3,620 427 | 2,592 508 | 1,010 183 | 1,582 325 | 1,028 -81 | 396 -47 | 632 -34 |
| 2018-19 | 3,689 69 | 2,726 134 | 1,077 67 | 1,649 67 | 963 -65 | 361 -35 | 602 -30 |
| 2019-20 | 3,681 -8 | 2,764 38 | 1,088 11 | 1,676 27 | 917 -46 | 312 -49 | 605 3 |
| 2020-21 | 3,653 -28 | 2,683 -81 | 1,063 -25 | 1,620 -56 | 970 53 | 311 -1 | 659 54 |
| 2021-22 | 3,439 -214 | 2,483 -200 | 1,029 -34 | 1,454 -166 | 956 -14 | 289 -22 | 667 8 |
| 2022-23 | 3,396 -43 | 2,510 27 | 1,026 -3 | 1,484 30 | 886 -70 | 250 -39 | 636 -31 |
| Average | 3,319 | 2,327 | 936 | 1,391 | 991 | 363 | 629 |