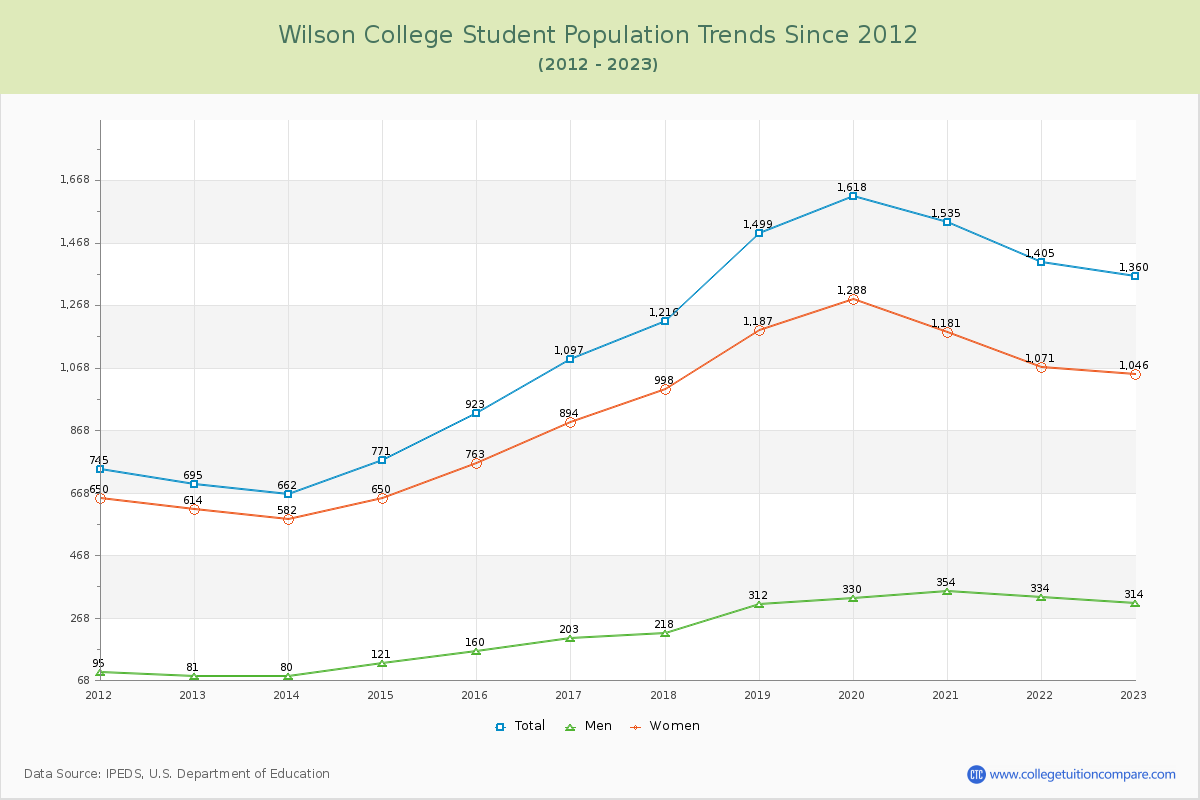
Student Population Changes
The average student population over the last 12 years is 1,162 where 1,360 students are attending the school for the academic year 2022-2023.
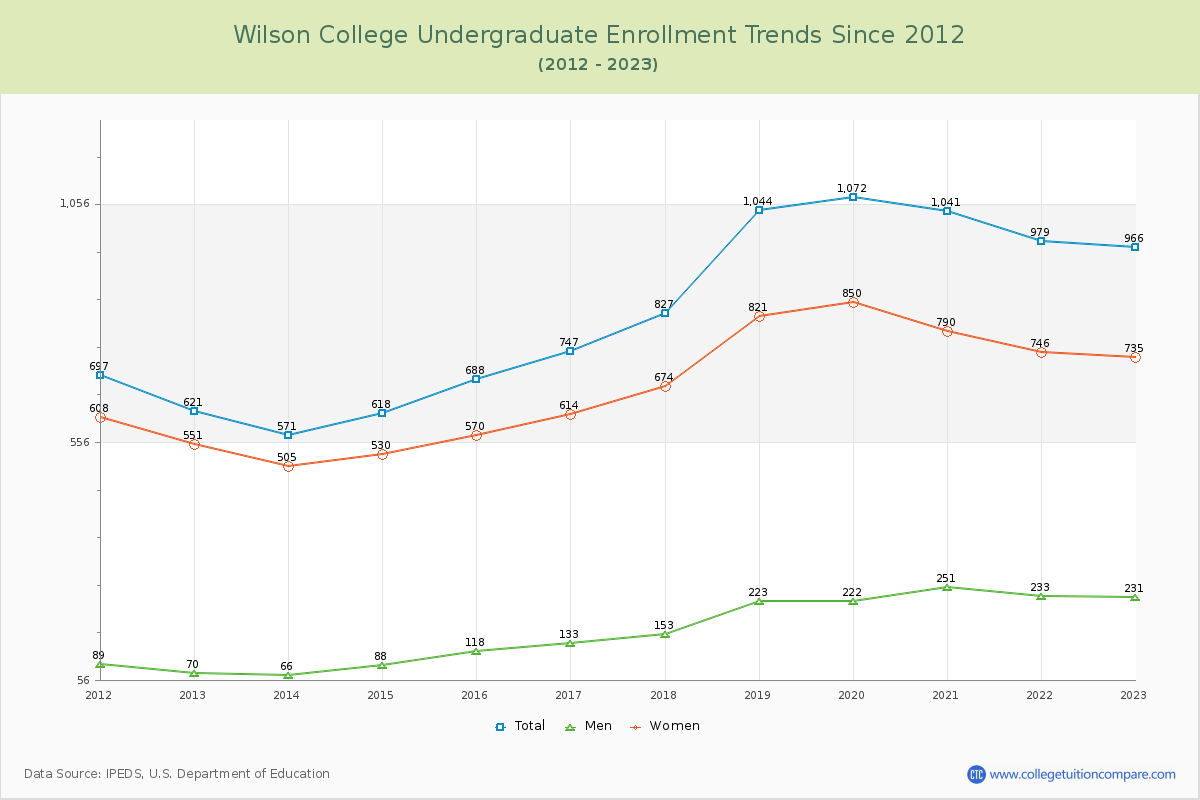
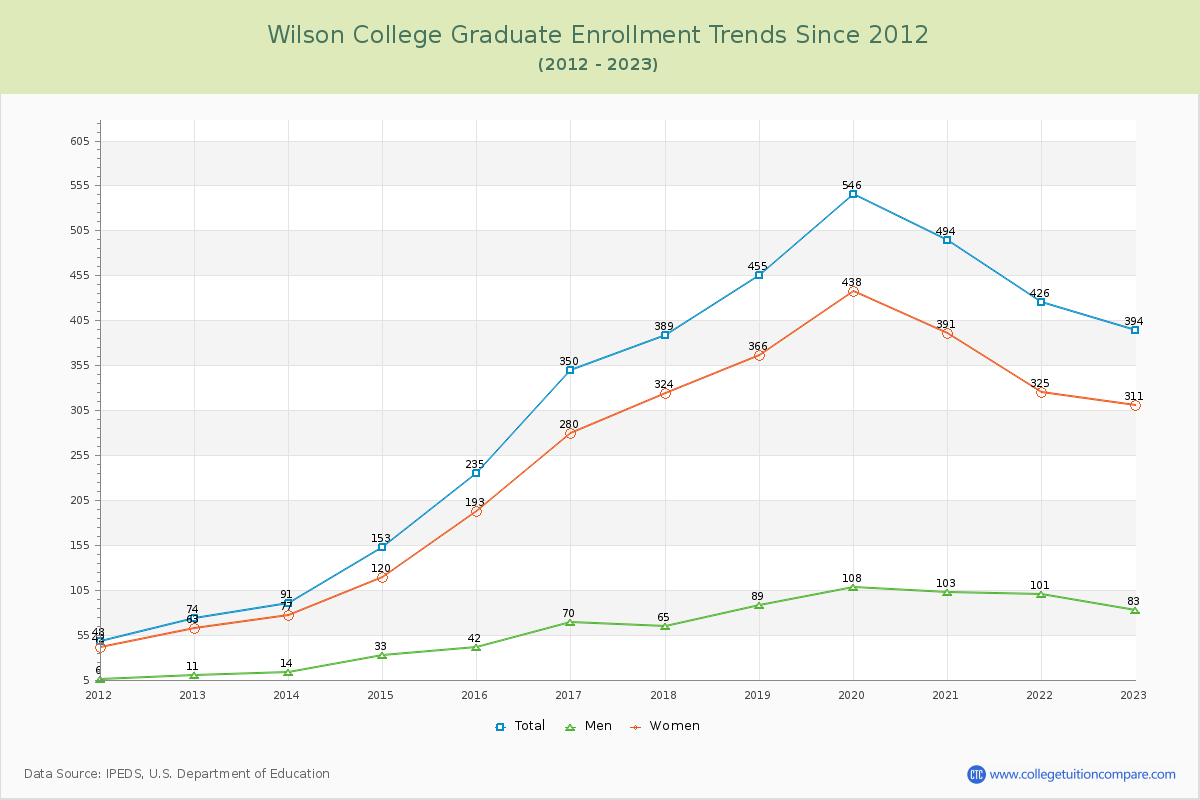
71.03% of total students is undergraduate students and 28.97% students is graduate students. The number of undergraduate students has increased by 345 and the graduate enrollment has increased by 320 over past 10 years.
The female to male ratio is 3.33 to 1 and it means that there are far more female students enrolled in Wilson than male students.
The following table and chart illustrate the changes in student population by gender at Wilson College since 2012.
| Year | Total | Undergraduate | Graduate | ||||
|---|---|---|---|---|---|---|---|
| Total | Men | Women | Total | Men | Women | ||
| 2012-13 | 695 | 621 | 70 | 551 | 74 | 11 | 63 |
| 2013-14 | 662 -33 | 571 -50 | 66 -4 | 505 -46 | 91 17 | 14 3 | 77 14 |
| 2014-15 | 771 109 | 618 47 | 88 22 | 530 25 | 153 62 | 33 19 | 120 43 |
| 2015-16 | 923 152 | 688 70 | 118 30 | 570 40 | 235 82 | 42 9 | 193 73 |
| 2016-17 | 1,097 174 | 747 59 | 133 15 | 614 44 | 350 115 | 70 28 | 280 87 |
| 2017-18 | 1,216 119 | 827 80 | 153 20 | 674 60 | 389 39 | 65 -5 | 324 44 |
| 2018-19 | 1,499 283 | 1,044 217 | 223 70 | 821 147 | 455 66 | 89 24 | 366 42 |
| 2019-20 | 1,618 119 | 1,072 28 | 222 -1 | 850 29 | 546 91 | 108 19 | 438 72 |
| 2020-21 | 1,535 -83 | 1,041 -31 | 251 29 | 790 -60 | 494 -52 | 103 -5 | 391 -47 |
| 2021-22 | 1,405 -130 | 979 -62 | 233 -18 | 746 -44 | 426 -68 | 101 -2 | 325 -66 |
| 2022-23 | 1,360 -45 | 966 -13 | 231 -2 | 735 -11 | 394 -32 | 83 -18 | 311 -14 |
| Average | 1,162 | 834 | 163 | 671 | 328 | 65 | 263 |