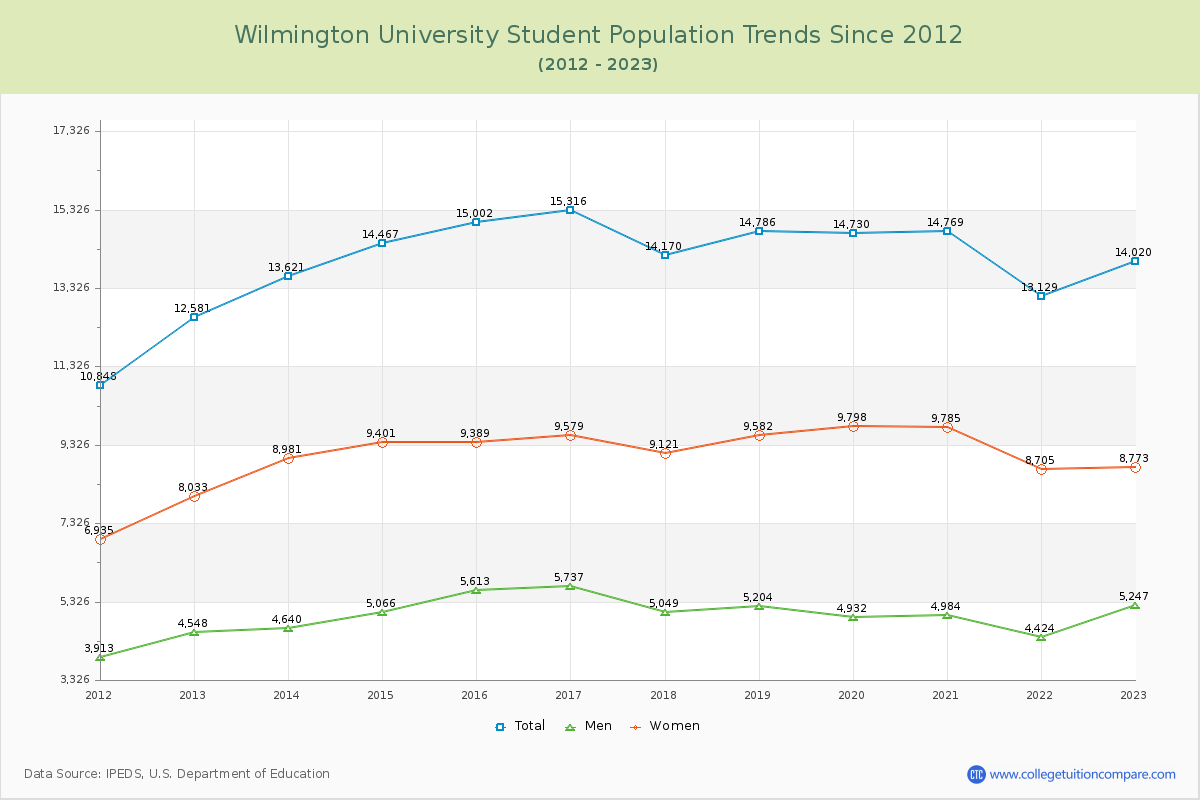
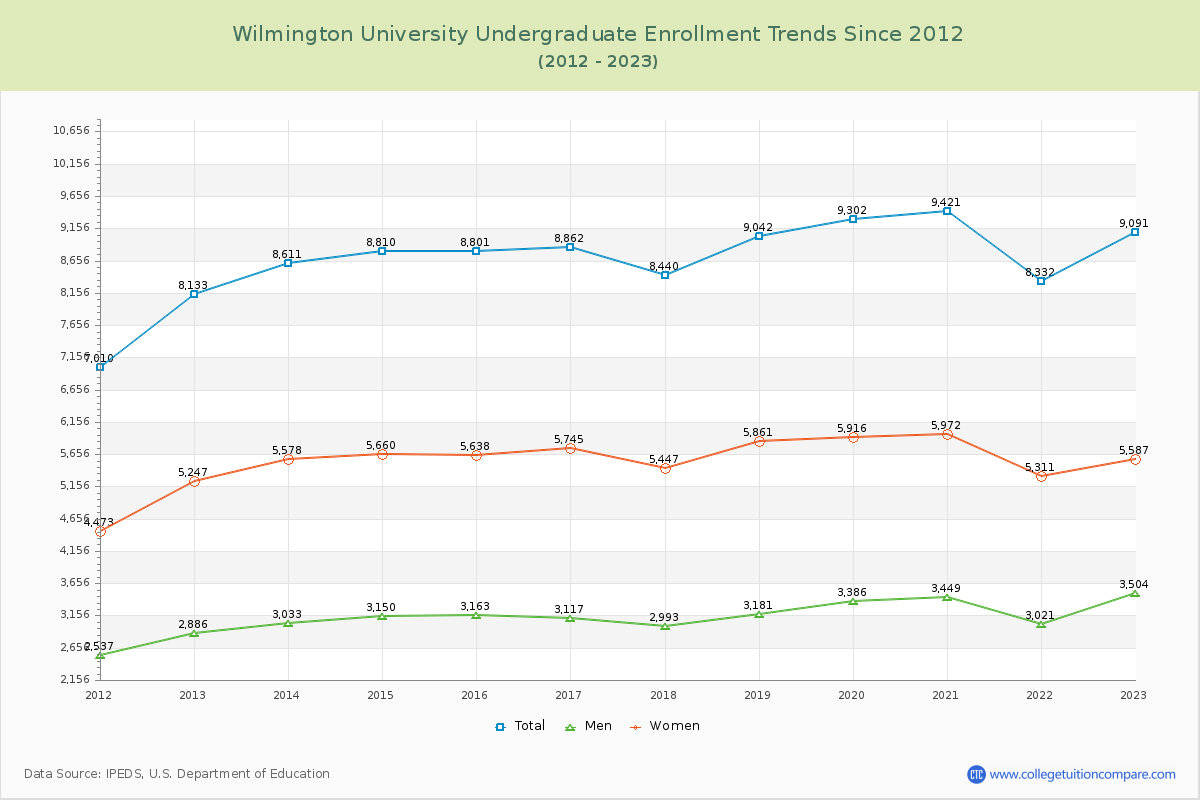
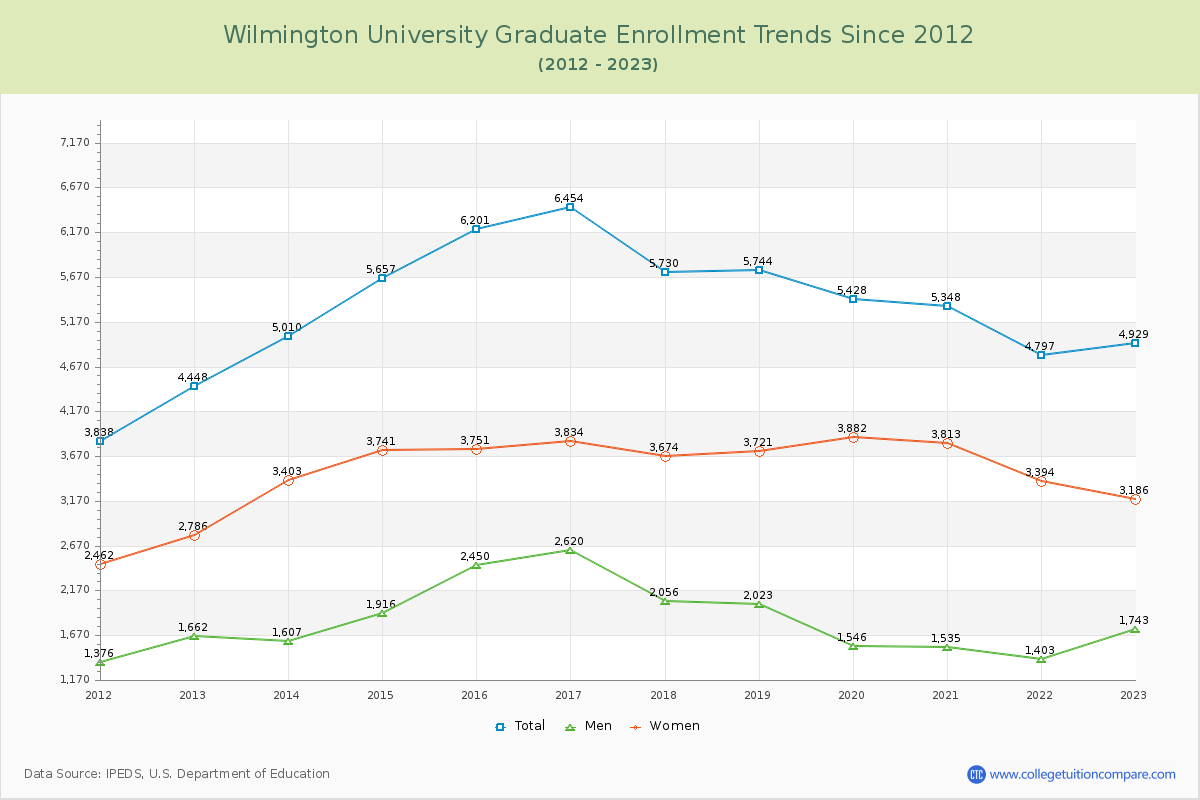
Student Population Changes
The average student population over the last 12 years is 14,236 where 14,020 students are attending the school for the academic year 2022-2023.
64.84% of total students is undergraduate students and 35.16% students is graduate students. The number of undergraduate students has increased by 958 and the graduate enrollment has increased by 481 over past 10 years.
The female to male ratio is 1.67 to 1 and it means that there are more female students enrolled in Wilmington than male students.
The following table and chart illustrate the changes in student population by gender at Wilmington University since 2012.
| Year | Total | Undergraduate | Graduate | ||||
|---|---|---|---|---|---|---|---|
| Total | Men | Women | Total | Men | Women | ||
| 2012-13 | 12,581 | 8,133 | 2,886 | 5,247 | 4,448 | 1,662 | 2,786 |
| 2013-14 | 13,621 1,040 | 8,611 478 | 3,033 147 | 5,578 331 | 5,010 562 | 1,607 -55 | 3,403 617 |
| 2014-15 | 14,467 846 | 8,810 199 | 3,150 117 | 5,660 82 | 5,657 647 | 1,916 309 | 3,741 338 |
| 2015-16 | 15,002 535 | 8,801 -9 | 3,163 13 | 5,638 -22 | 6,201 544 | 2,450 534 | 3,751 10 |
| 2016-17 | 15,316 314 | 8,862 61 | 3,117 -46 | 5,745 107 | 6,454 253 | 2,620 170 | 3,834 83 |
| 2017-18 | 14,170 -1,146 | 8,440 -422 | 2,993 -124 | 5,447 -298 | 5,730 -724 | 2,056 -564 | 3,674 -160 |
| 2018-19 | 14,786 616 | 9,042 602 | 3,181 188 | 5,861 414 | 5,744 14 | 2,023 -33 | 3,721 47 |
| 2019-20 | 14,730 -56 | 9,302 260 | 3,386 205 | 5,916 55 | 5,428 -316 | 1,546 -477 | 3,882 161 |
| 2020-21 | 14,769 39 | 9,421 119 | 3,449 63 | 5,972 56 | 5,348 -80 | 1,535 -11 | 3,813 -69 |
| 2021-22 | 13,129 -1,640 | 8,332 -1,089 | 3,021 -428 | 5,311 -661 | 4,797 -551 | 1,403 -132 | 3,394 -419 |
| 2022-23 | 14,020 891 | 9,091 759 | 3,504 483 | 5,587 276 | 4,929 132 | 1,743 340 | 3,186 -208 |
| Average | 14,236 | 8,804 | 3,171 | 5,633 | 5,431 | 1,869 | 3,562 |