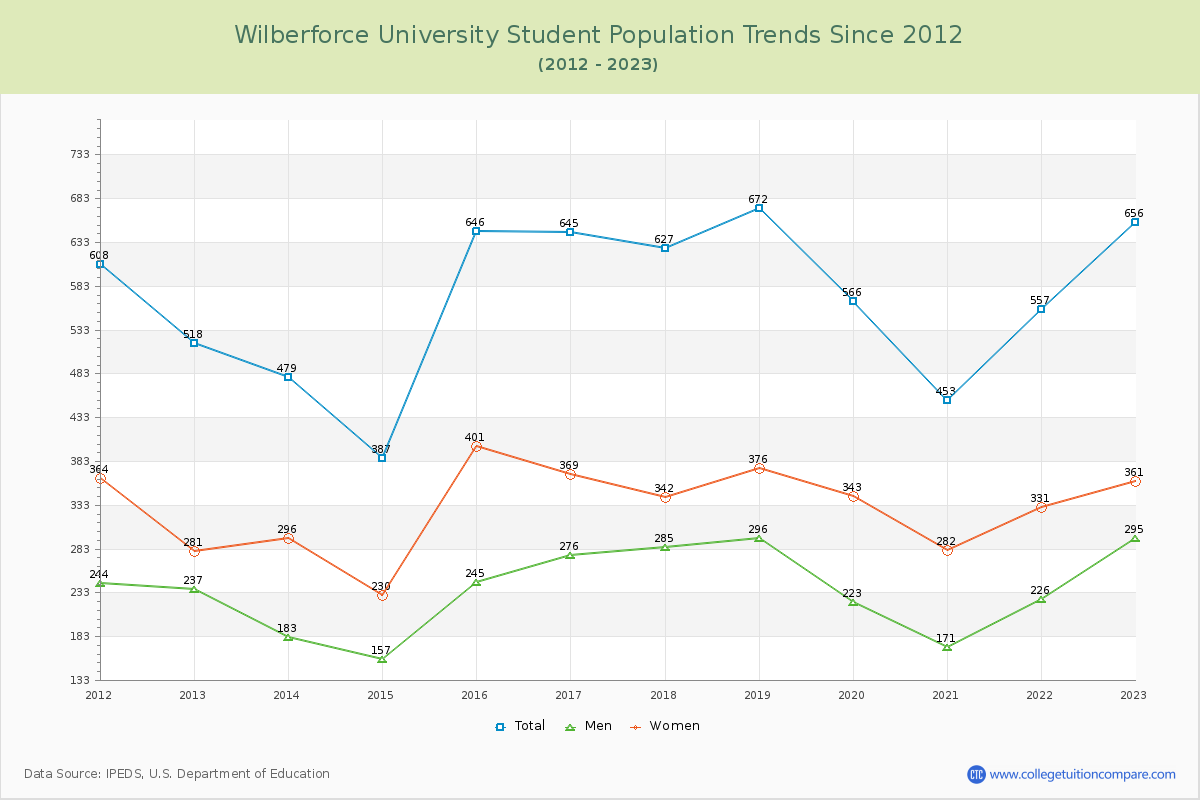
Student Population Changes
The average student population over the last 12 years is 564 where 656 students are attending the school for the academic year 2022-2023.
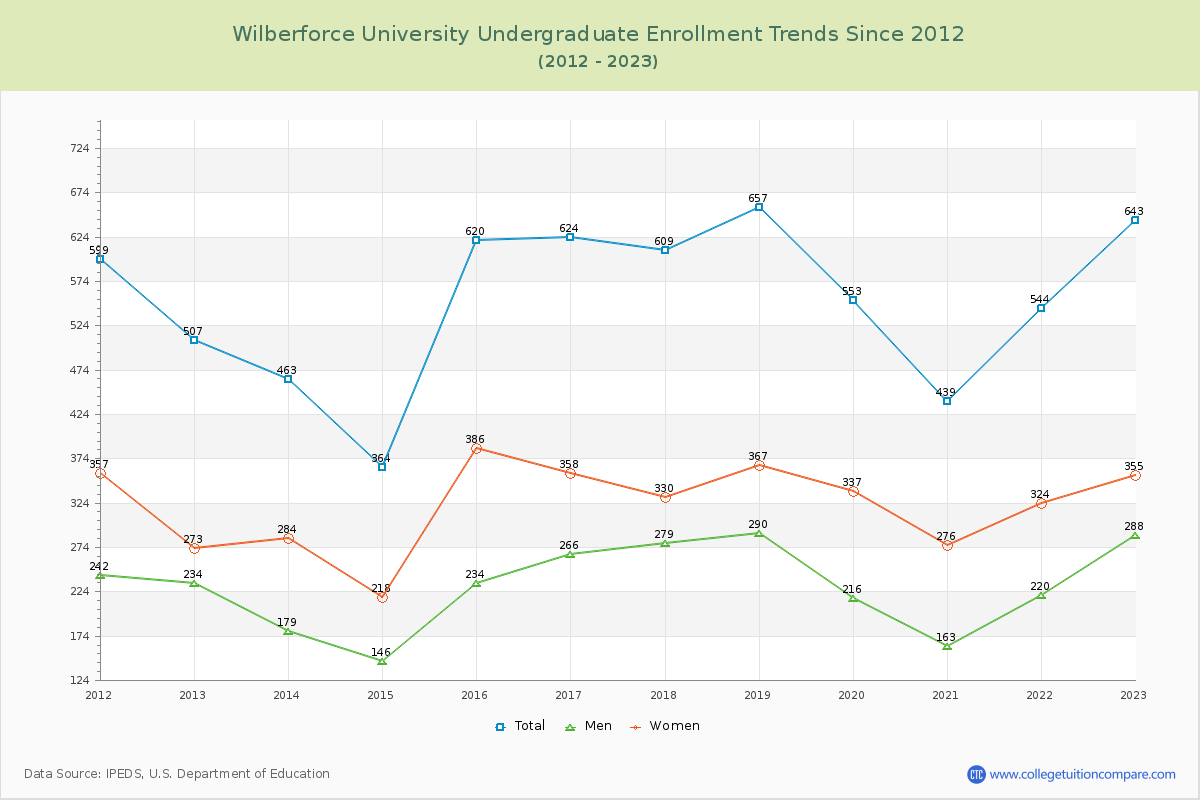
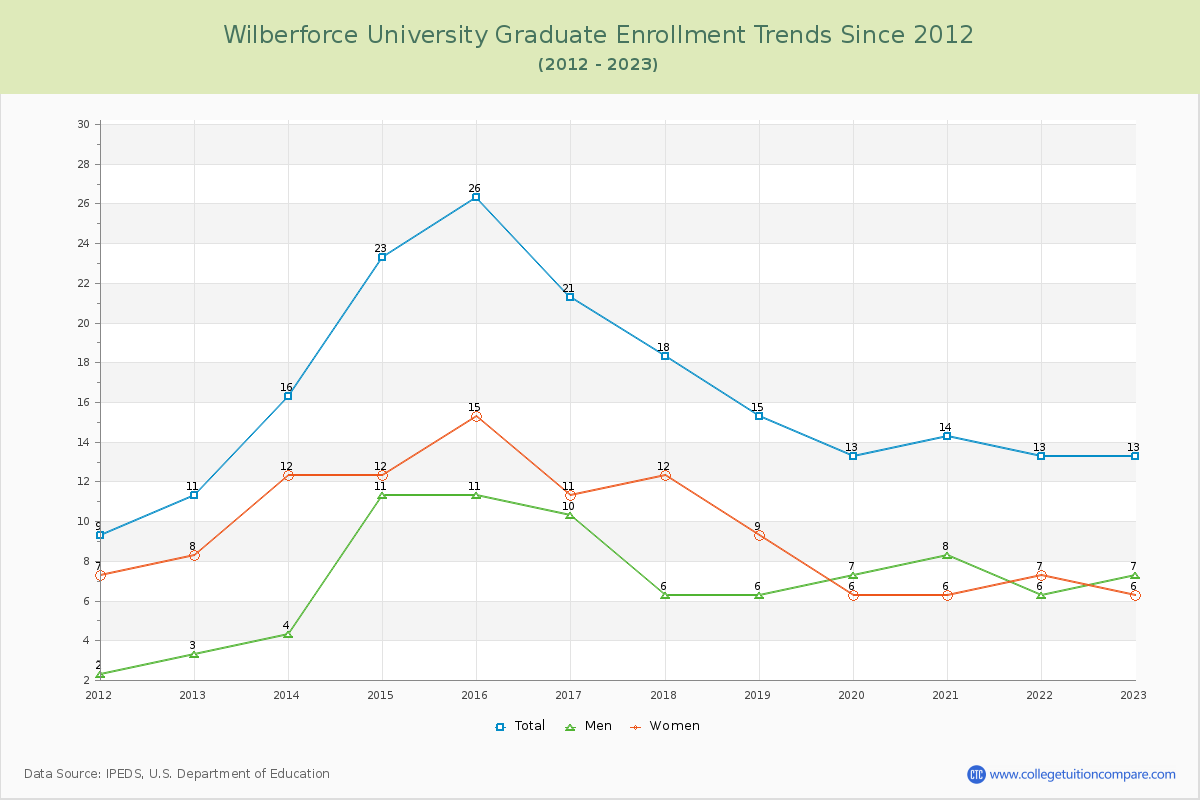
98.02% of total students is undergraduate students and 1.98% students is graduate students. The number of undergraduate students has increased by 136 and the graduate enrollment has increased by 2 over past 10 years.
The female to male ratio is 1.22 to 1 and it means that there are slightly more female students enrolled in Wilberforce than male students.
The following table and chart illustrate the changes in student population by gender at Wilberforce University since 2012.
| Year | Total | Undergraduate | Graduate | ||||
|---|---|---|---|---|---|---|---|
| Total | Men | Women | Total | Men | Women | ||
| 2012-13 | 518 | 507 | 234 | 273 | 11 | 3 | 8 |
| 2013-14 | 479 -39 | 463 -44 | 179 -55 | 284 11 | 16 5 | 4 1 | 12 4 |
| 2014-15 | 387 -92 | 364 -99 | 146 -33 | 218 -66 | 23 7 | 11 7 | 12 0 |
| 2015-16 | 646 259 | 620 256 | 234 88 | 386 168 | 26 3 | 11 0 | 15 3 |
| 2016-17 | 645 -1 | 624 4 | 266 32 | 358 -28 | 21 -5 | 10 -1 | 11 -4 |
| 2017-18 | 627 -18 | 609 -15 | 279 13 | 330 -28 | 18 -3 | 6 -4 | 12 1 |
| 2018-19 | 672 45 | 657 48 | 290 11 | 367 37 | 15 -3 | 6 0 | 9 -3 |
| 2019-20 | 566 -106 | 553 -104 | 216 -74 | 337 -30 | 13 -2 | 7 1 | 6 -3 |
| 2020-21 | 453 -113 | 439 -114 | 163 -53 | 276 -61 | 14 1 | 8 1 | 6 0 |
| 2021-22 | 557 104 | 544 105 | 220 57 | 324 48 | 13 -1 | 6 -2 | 7 1 |
| 2022-23 | 656 99 | 643 99 | 288 68 | 355 31 | 13 0 | 7 1 | 6 -1 |
| Average | 564 | 548 | 229 | 319 | 17 | 7 | 9 |