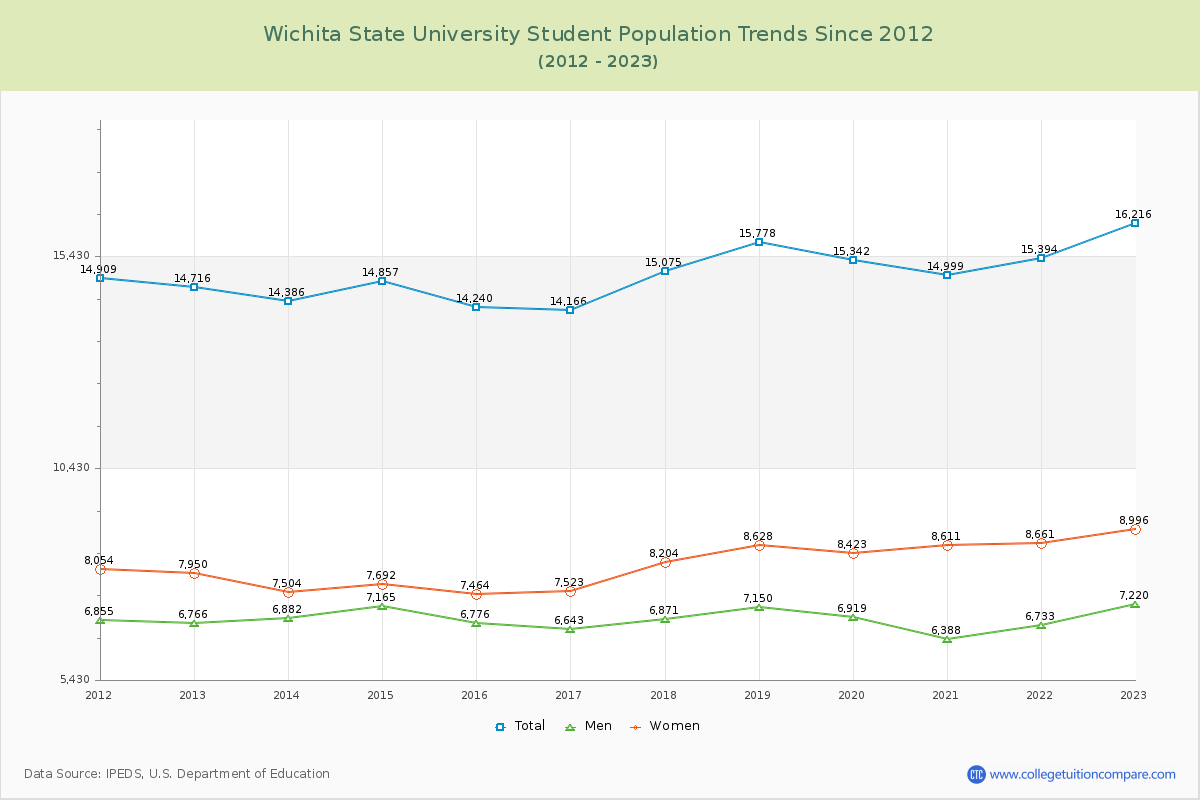
Student Population Changes
The average student population over the last 12 years is 15,015 where 16,216 students are attending the school for the academic year 2022-2023.
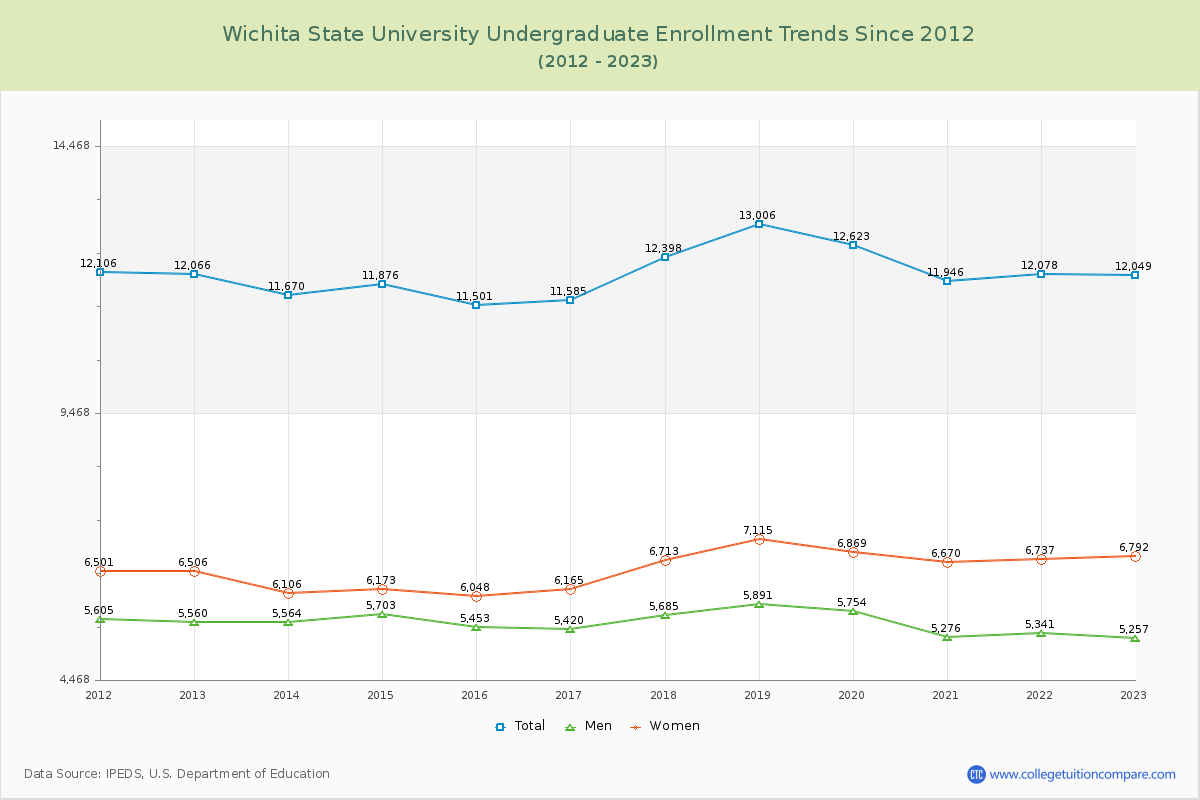
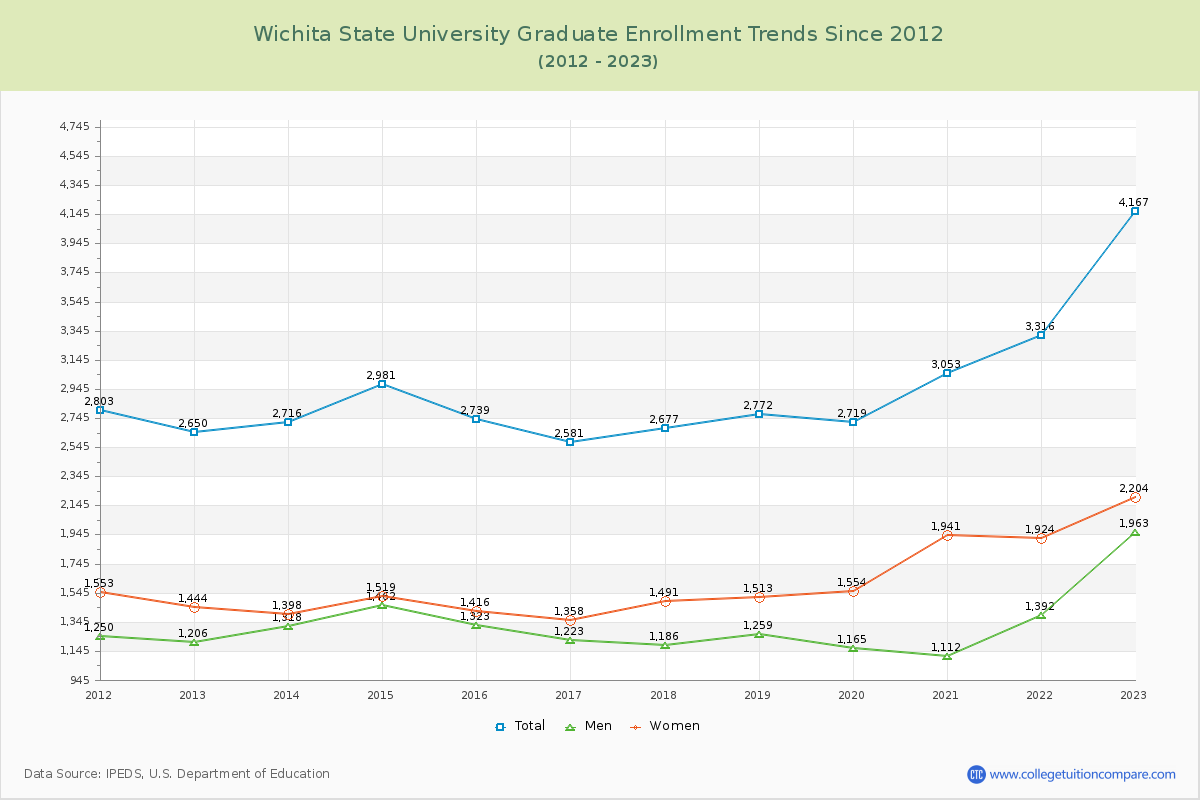
74.30% of total students is undergraduate students and 25.70% students is graduate students. The number of undergraduate students has decreased by 17 and the graduate enrollment has increased by 1,517 over past 10 years.
The female to male ratio is 1.25 to 1 and it means that there are slightly more female students enrolled in WSU than male students.
The following table and chart illustrate the changes in student population by gender at Wichita State University since 2012.
| Year | Total | Undergraduate | Graduate | ||||
|---|---|---|---|---|---|---|---|
| Total | Men | Women | Total | Men | Women | ||
| 2012-13 | 14,716 | 12,066 | 5,560 | 6,506 | 2,650 | 1,206 | 1,444 |
| 2013-14 | 14,386 -330 | 11,670 -396 | 5,564 4 | 6,106 -400 | 2,716 66 | 1,318 112 | 1,398 -46 |
| 2014-15 | 14,857 471 | 11,876 206 | 5,703 139 | 6,173 67 | 2,981 265 | 1,462 144 | 1,519 121 |
| 2015-16 | 14,240 -617 | 11,501 -375 | 5,453 -250 | 6,048 -125 | 2,739 -242 | 1,323 -139 | 1,416 -103 |
| 2016-17 | 14,166 -74 | 11,585 84 | 5,420 -33 | 6,165 117 | 2,581 -158 | 1,223 -100 | 1,358 -58 |
| 2017-18 | 15,075 909 | 12,398 813 | 5,685 265 | 6,713 548 | 2,677 96 | 1,186 -37 | 1,491 133 |
| 2018-19 | 15,778 703 | 13,006 608 | 5,891 206 | 7,115 402 | 2,772 95 | 1,259 73 | 1,513 22 |
| 2019-20 | 15,342 -436 | 12,623 -383 | 5,754 -137 | 6,869 -246 | 2,719 -53 | 1,165 -94 | 1,554 41 |
| 2020-21 | 14,999 -343 | 11,946 -677 | 5,276 -478 | 6,670 -199 | 3,053 334 | 1,112 -53 | 1,941 387 |
| 2021-22 | 15,394 395 | 12,078 132 | 5,341 65 | 6,737 67 | 3,316 263 | 1,392 280 | 1,924 -17 |
| 2022-23 | 16,216 822 | 12,049 -29 | 5,257 -84 | 6,792 55 | 4,167 851 | 1,963 571 | 2,204 280 |
| Average | 15,015 | 12,073 | 5,537 | 6,536 | 2,943 | 1,328 | 1,615 |