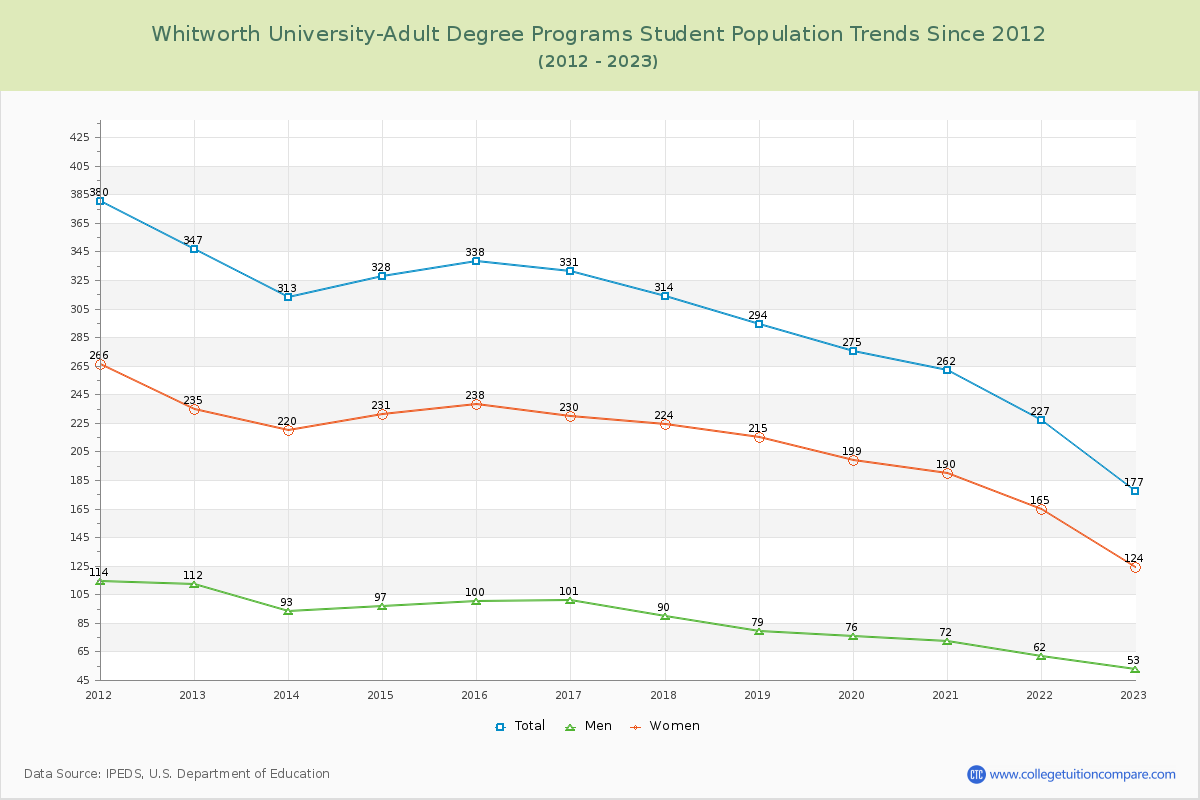
Student Population Changes
The average student population over the last 12 years is 285 where 177 students are attending the school for the academic year 2022-2023.
The female to male ratio is 2.34 to 1 and it means that there are far more female students enrolled in Whitworth University-Adult Degree Programs than male students.
The following table and chart illustrate the changes in student population by gender at Whitworth University-Adult Degree Programs since 2012.
| Year | Total | Men | Women |
|---|---|---|---|
| 2012-13 | 332 | 108 | 224 |
| 2013-14 | 310 -22 | 93 -15 | 217 -7 |
| 2014-15 | 317 7 | 93 0 | 224 7 |
| 2015-16 | 319 2 | 93 0 | 226 2 |
| 2016-17 | 309 -10 | 95 2 | 214 -12 |
| 2017-18 | 314 5 | 90 -5 | 224 10 |
| 2018-19 | 294 -20 | 79 -11 | 215 -9 |
| 2019-20 | 275 -19 | 76 -3 | 199 -16 |
| 2020-21 | 262 -13 | 72 -4 | 190 -9 |
| 2021-22 | 227 -35 | 62 -10 | 165 -25 |
| 2022-23 | 177 -50 | 53 -9 | 124 -41 |
| Average | 285 | 83 | 202 |