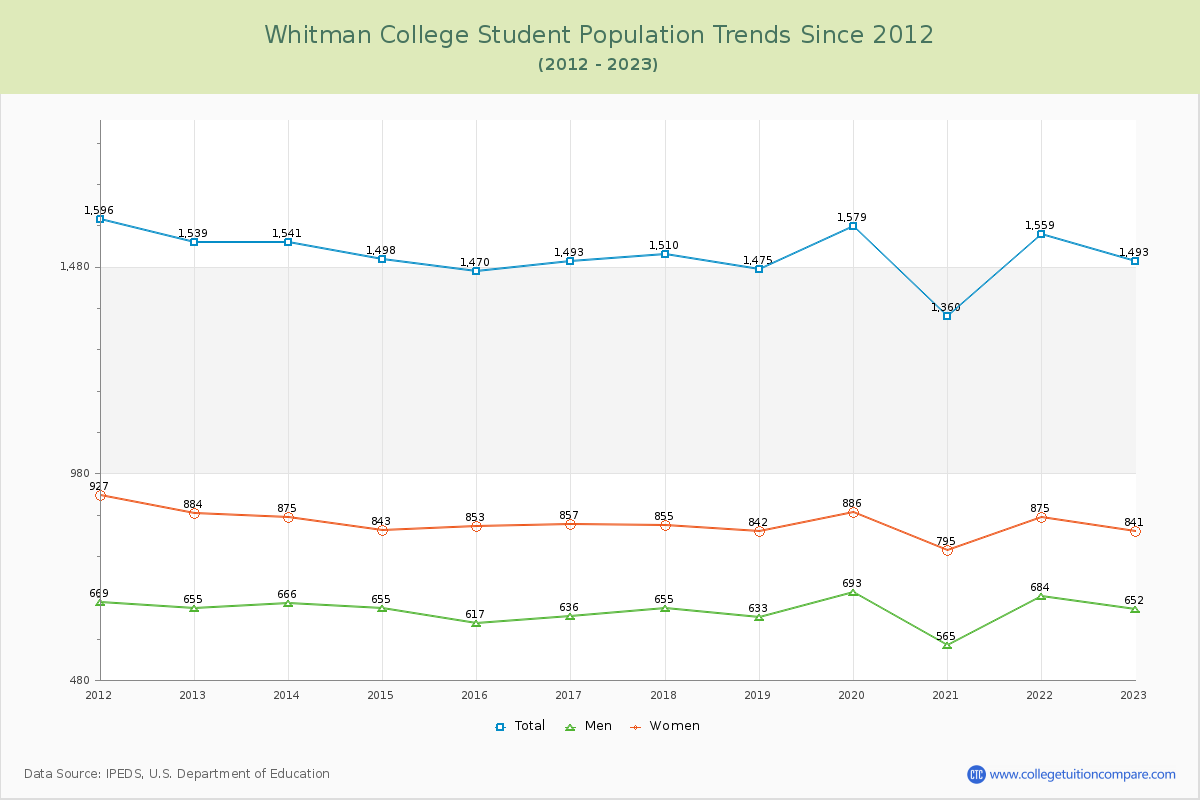
Student Population Changes
The average student population over the last 12 years is 1,502 where 1,493 students are attending the school for the academic year 2022-2023.
The female to male ratio is 1.29 to 1 and it means that there are slightly more female students enrolled in Whitman than male students.
The following table and chart illustrate the changes in student population by gender at Whitman College since 2012.
| Year | Total | Men | Women |
|---|---|---|---|
| 2012-13 | 1,539 | 655 | 884 |
| 2013-14 | 1,541 2 | 666 11 | 875 -9 |
| 2014-15 | 1,498 -43 | 655 -11 | 843 -32 |
| 2015-16 | 1,470 -28 | 617 -38 | 853 10 |
| 2016-17 | 1,493 23 | 636 19 | 857 4 |
| 2017-18 | 1,510 17 | 655 19 | 855 -2 |
| 2018-19 | 1,475 -35 | 633 -22 | 842 -13 |
| 2019-20 | 1,579 104 | 693 60 | 886 44 |
| 2020-21 | 1,360 -219 | 565 -128 | 795 -91 |
| 2021-22 | 1,559 199 | 684 119 | 875 80 |
| 2022-23 | 1,493 -66 | 652 -32 | 841 -34 |
| Average | 1,502 | 646 | 855 |