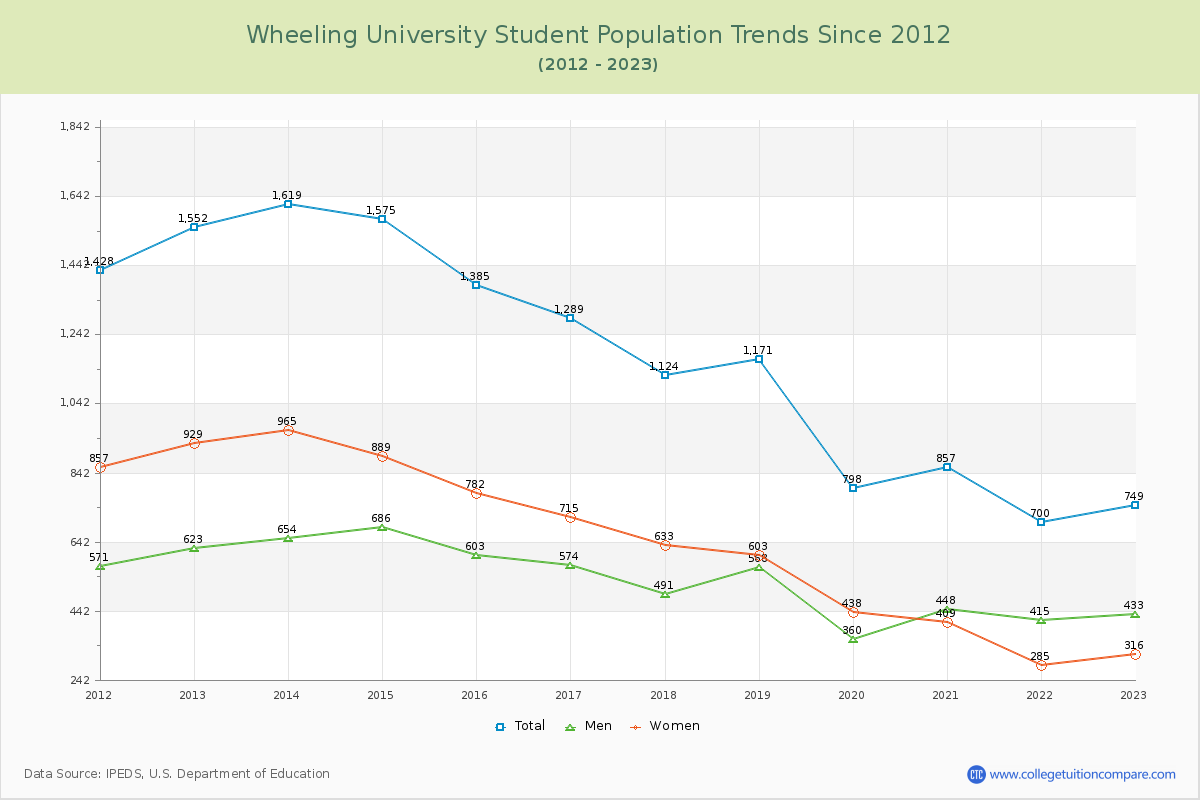
Student Population Changes
The average student population over the last 12 years is 1,165 where 749 students are attending the school for the academic year 2022-2023.
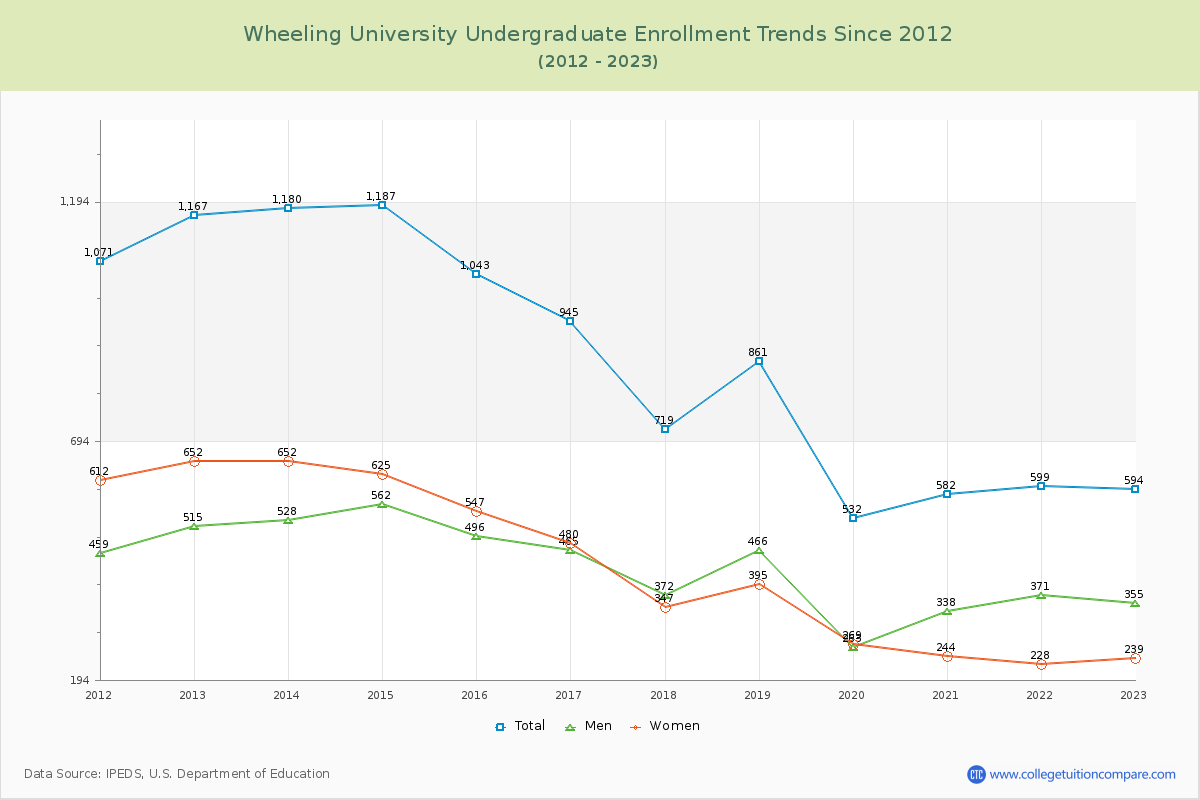
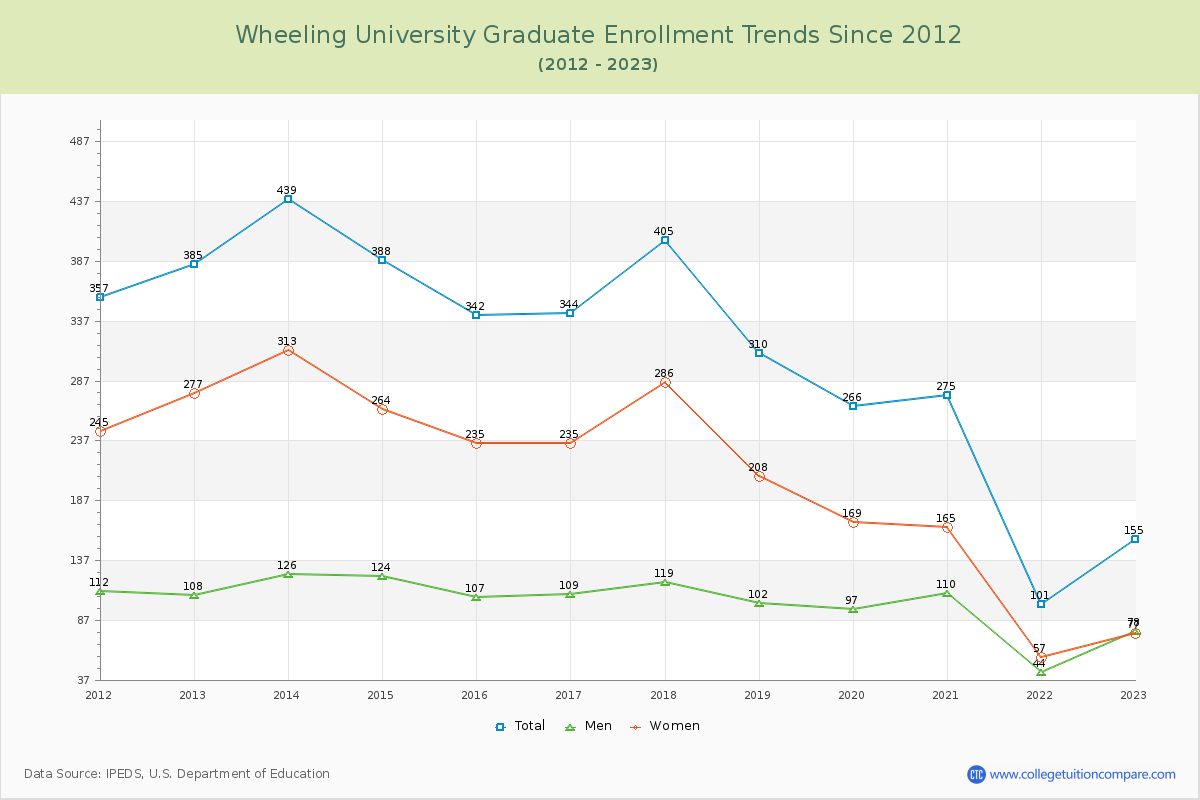
79.31% of total students is undergraduate students and 20.69% students is graduate students. The number of undergraduate students has decreased by 573 and the graduate enrollment has decreased by 230 over past 10 years.
The female to male ratio is 0.73 to 1 and it means that there are more male students enrolled in Wheeling than female students.
The following table and chart illustrate the changes in student population by gender at Wheeling University since 2012.
| Year | Total | Undergraduate | Graduate | ||||
|---|---|---|---|---|---|---|---|
| Total | Men | Women | Total | Men | Women | ||
| 2012-13 | 1,552 | 1,167 | 515 | 652 | 385 | 108 | 277 |
| 2013-14 | 1,619 67 | 1,180 13 | 528 13 | 652 0 | 439 54 | 126 18 | 313 36 |
| 2014-15 | 1,575 -44 | 1,187 7 | 562 34 | 625 -27 | 388 -51 | 124 -2 | 264 -49 |
| 2015-16 | 1,385 -190 | 1,043 -144 | 496 -66 | 547 -78 | 342 -46 | 107 -17 | 235 -29 |
| 2016-17 | 1,289 -96 | 945 -98 | 465 -31 | 480 -67 | 344 2 | 109 2 | 235 0 |
| 2017-18 | 1,124 -165 | 719 -226 | 372 -93 | 347 -133 | 405 61 | 119 10 | 286 51 |
| 2018-19 | 1,171 47 | 861 142 | 466 94 | 395 48 | 310 -95 | 102 -17 | 208 -78 |
| 2019-20 | 798 -373 | 532 -329 | 263 -203 | 269 -126 | 266 -44 | 97 -5 | 169 -39 |
| 2020-21 | 857 59 | 582 50 | 338 75 | 244 -25 | 275 9 | 110 13 | 165 -4 |
| 2021-22 | 700 -157 | 599 17 | 371 33 | 228 -16 | 101 -174 | 44 -66 | 57 -108 |
| 2022-23 | 749 49 | 594 -5 | 355 -16 | 239 11 | 155 54 | 78 34 | 77 20 |
| Average | 1,165 | 855 | 430 | 425 | 310 | 102 | 208 |