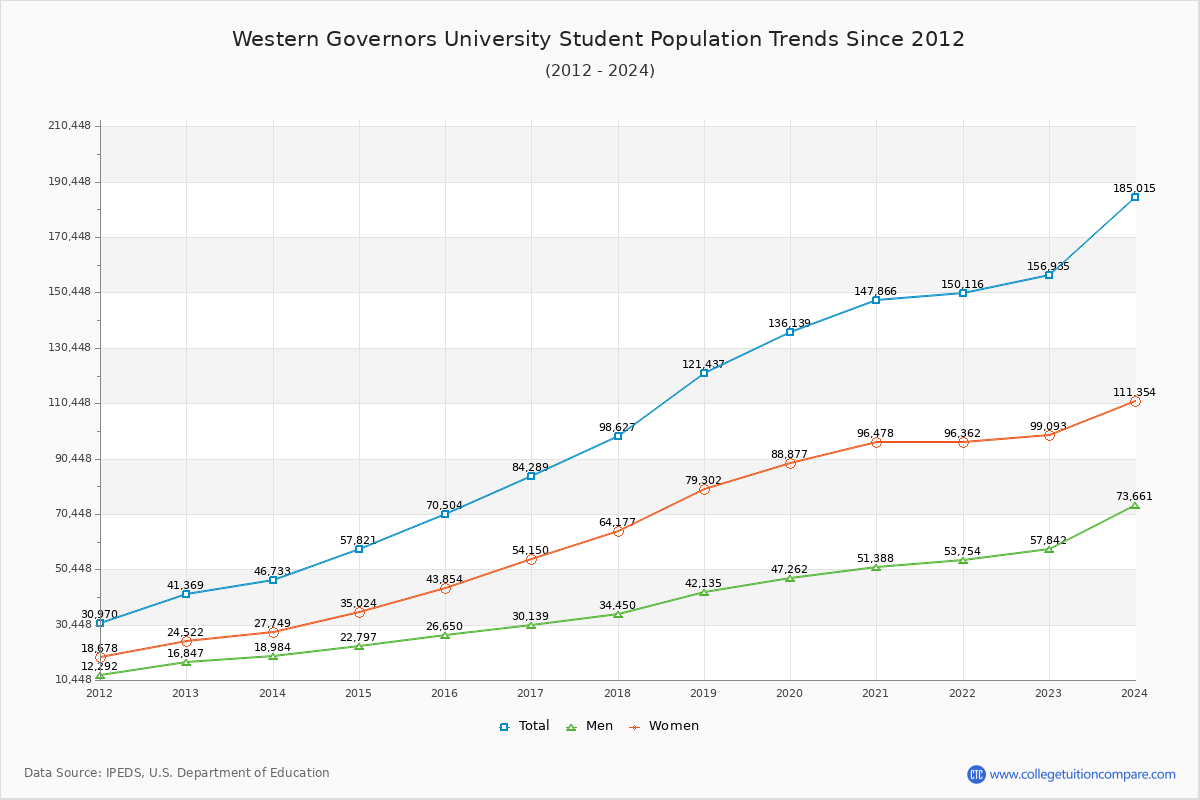
Student Population Changes
The average student population over the last 12 years is 101,076 where 156,935 students are attending the school for the academic year 2022-2023.
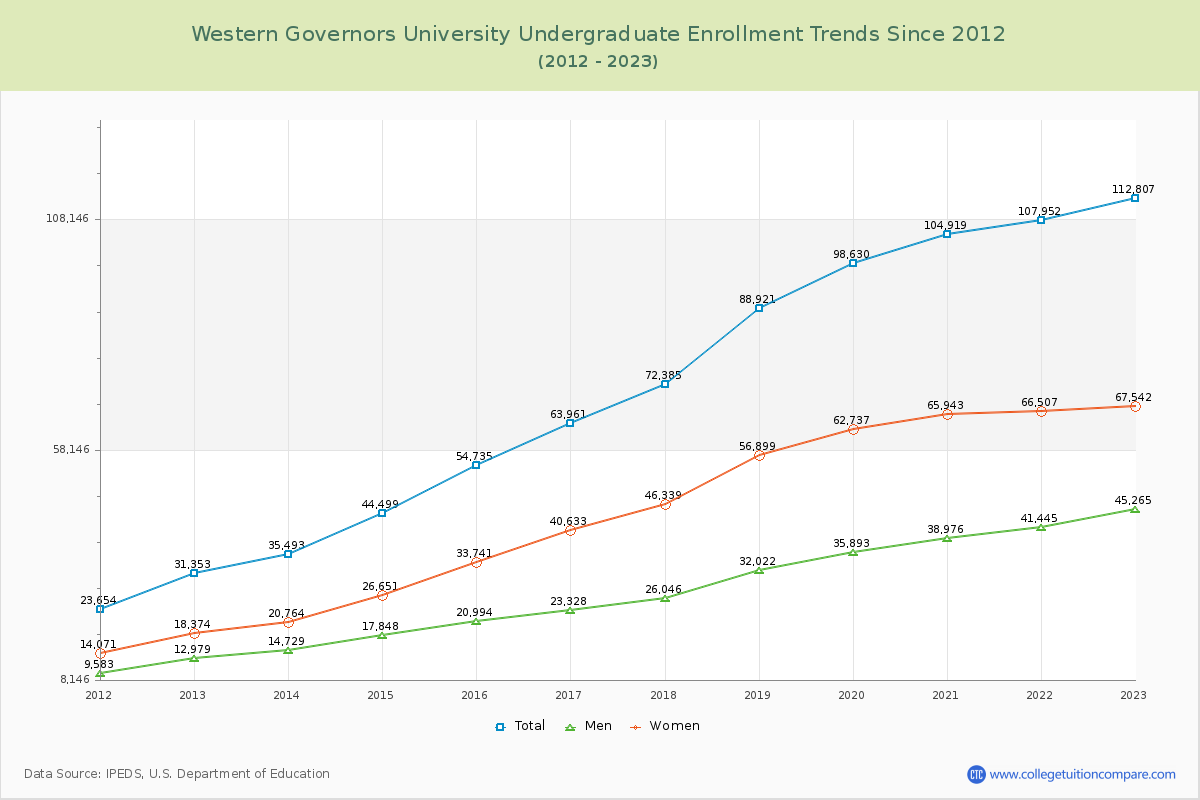
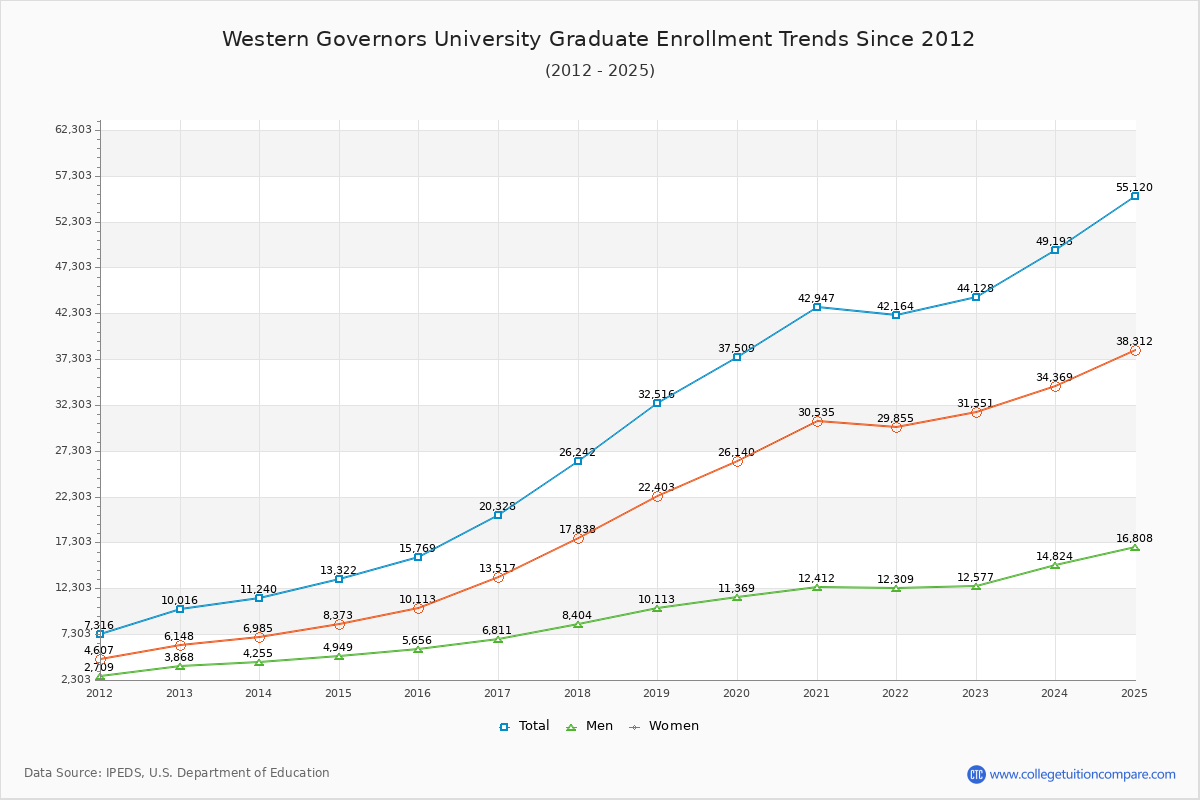
71.88% of total students is undergraduate students and 28.12% students is graduate students. The number of undergraduate students has increased by 81,454 and the graduate enrollment has increased by 34,112 over past 10 years.
The female to male ratio is 1.71 to 1 and it means that there are more female students enrolled in WGU than male students.
The following table and chart illustrate the changes in student population by gender at Western Governors University since 2012.
| Year | Total | Undergraduate | Graduate | ||||
|---|---|---|---|---|---|---|---|
| Total | Men | Women | Total | Men | Women | ||
| 2012-13 | 41,369 | 31,353 | 12,979 | 18,374 | 10,016 | 3,868 | 6,148 |
| 2013-14 | 46,733 5,364 | 35,493 4,140 | 14,729 1,750 | 20,764 2,390 | 11,240 1,224 | 4,255 387 | 6,985 837 |
| 2014-15 | 57,821 11,088 | 44,499 9,006 | 17,848 3,119 | 26,651 5,887 | 13,322 2,082 | 4,949 694 | 8,373 1,388 |
| 2015-16 | 70,504 12,683 | 54,735 10,236 | 20,994 3,146 | 33,741 7,090 | 15,769 2,447 | 5,656 707 | 10,113 1,740 |
| 2016-17 | 84,289 13,785 | 63,961 9,226 | 23,328 2,334 | 40,633 6,892 | 20,328 4,559 | 6,811 1,155 | 13,517 3,404 |
| 2017-18 | 98,627 14,338 | 72,385 8,424 | 26,046 2,718 | 46,339 5,706 | 26,242 5,914 | 8,404 1,593 | 17,838 4,321 |
| 2018-19 | 121,437 22,810 | 88,921 16,536 | 32,022 5,976 | 56,899 10,560 | 32,516 6,274 | 10,113 1,709 | 22,403 4,565 |
| 2019-20 | 136,139 14,702 | 98,630 9,709 | 35,893 3,871 | 62,737 5,838 | 37,509 4,993 | 11,369 1,256 | 26,140 3,737 |
| 2020-21 | 147,866 11,727 | 104,919 6,289 | 38,976 3,083 | 65,943 3,206 | 42,947 5,438 | 12,412 1,043 | 30,535 4,395 |
| 2021-22 | 150,116 2,250 | 107,952 3,033 | 41,445 2,469 | 66,507 564 | 42,164 -783 | 12,309 -103 | 29,855 -680 |
| 2022-23 | 156,935 6,819 | 112,807 4,855 | 45,265 3,820 | 67,542 1,035 | 44,128 1,964 | 12,577 268 | 31,551 1,696 |
| Average | 101,076 | 74,150 | 28,139 | 46,012 | 26,926 | 8,429 | 18,496 |